I transform data exports, maps and charts into visuals that communicate effectively, whether the audience is a peer reviewer, a policymaker or the general public.
Every visualisation is designed with accessibility, visual hierarchy and accuracy in mind, so your findings are never lost in cluttered or illegible presentation.
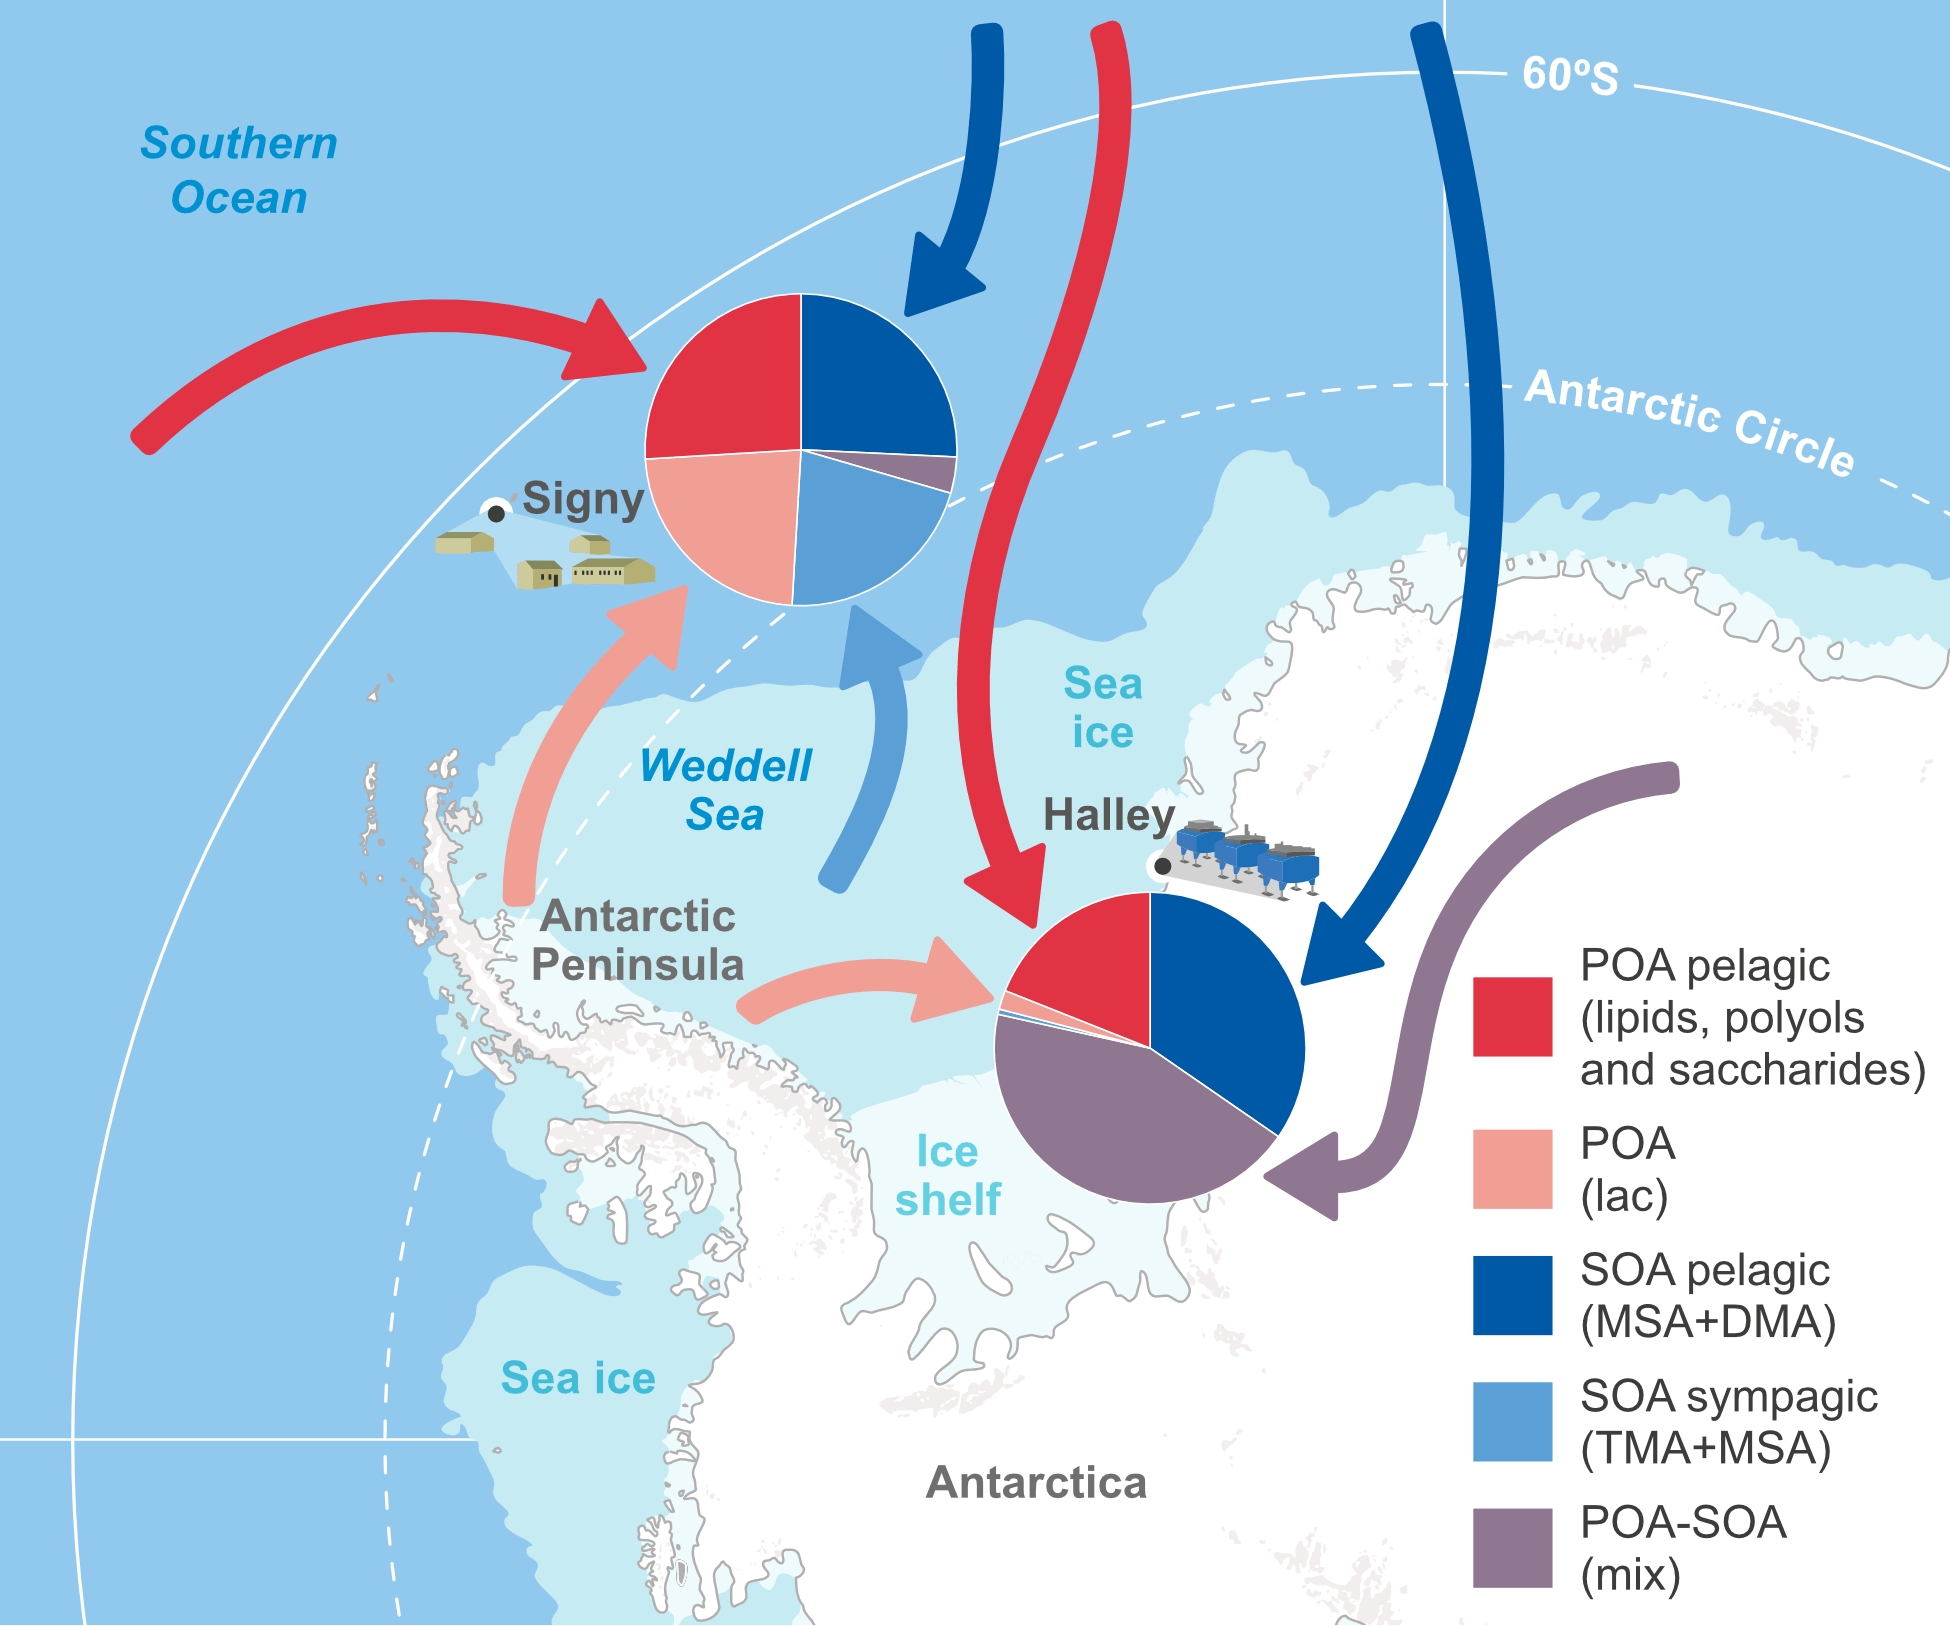
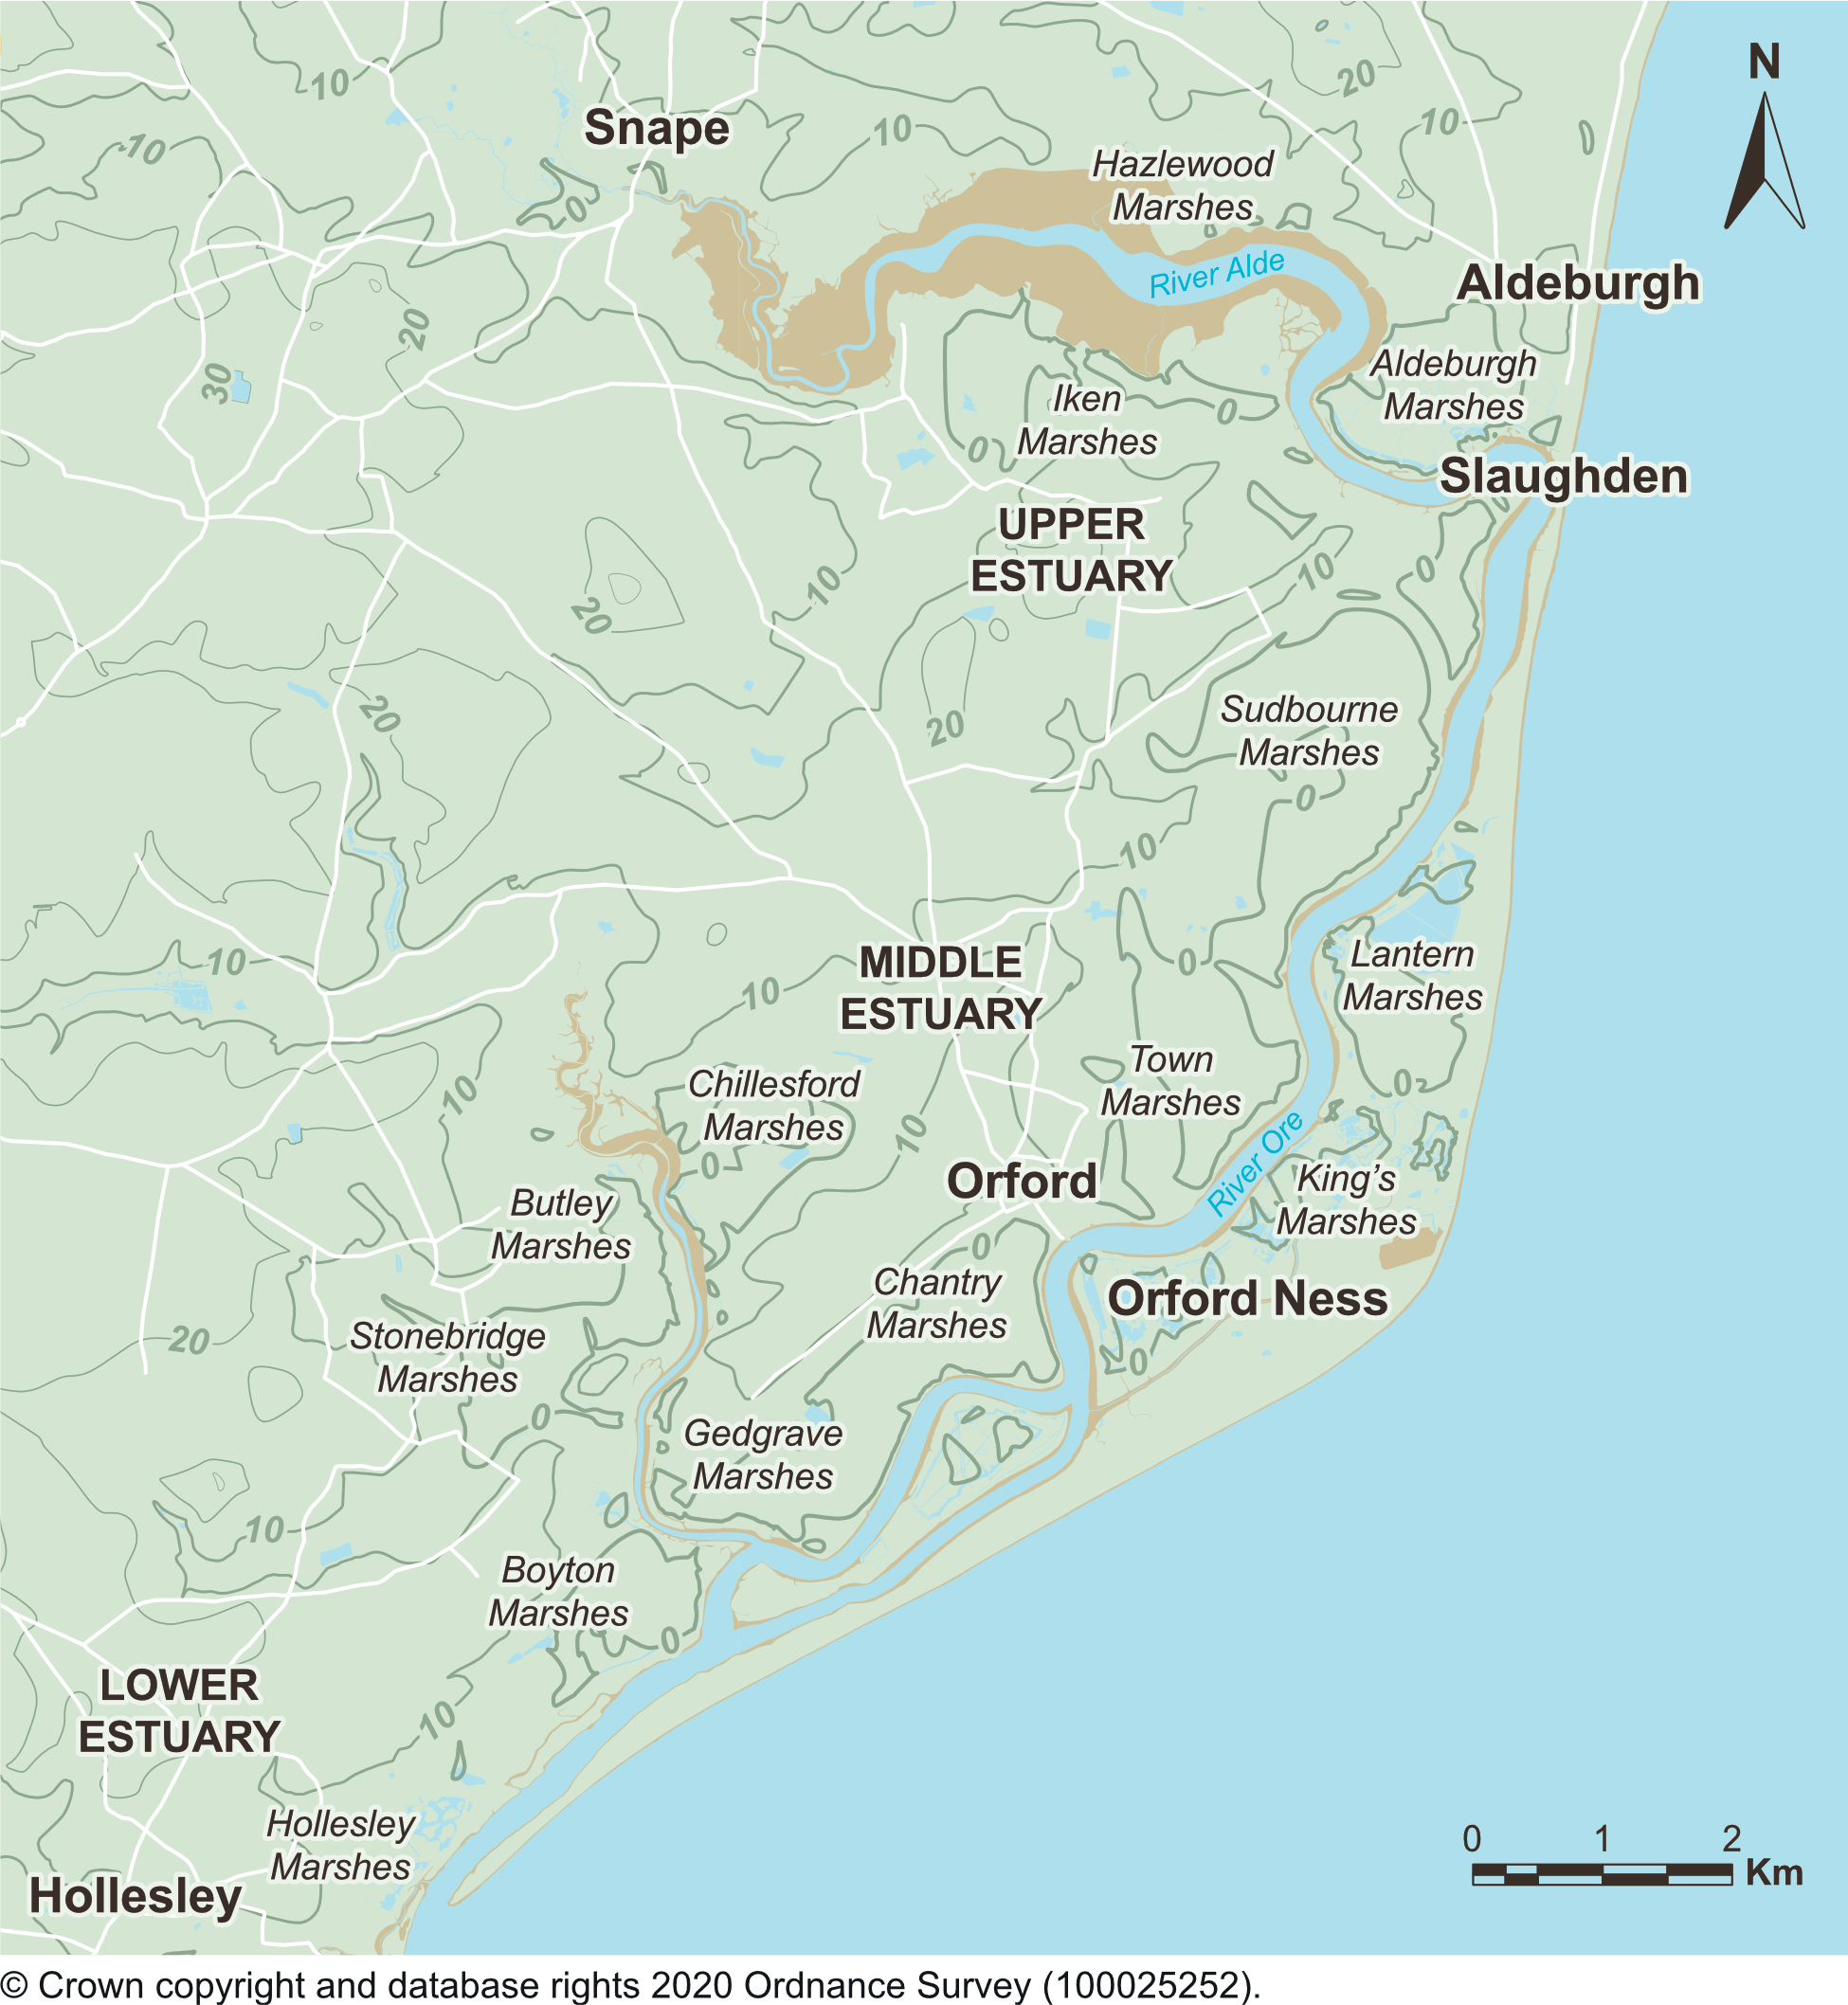
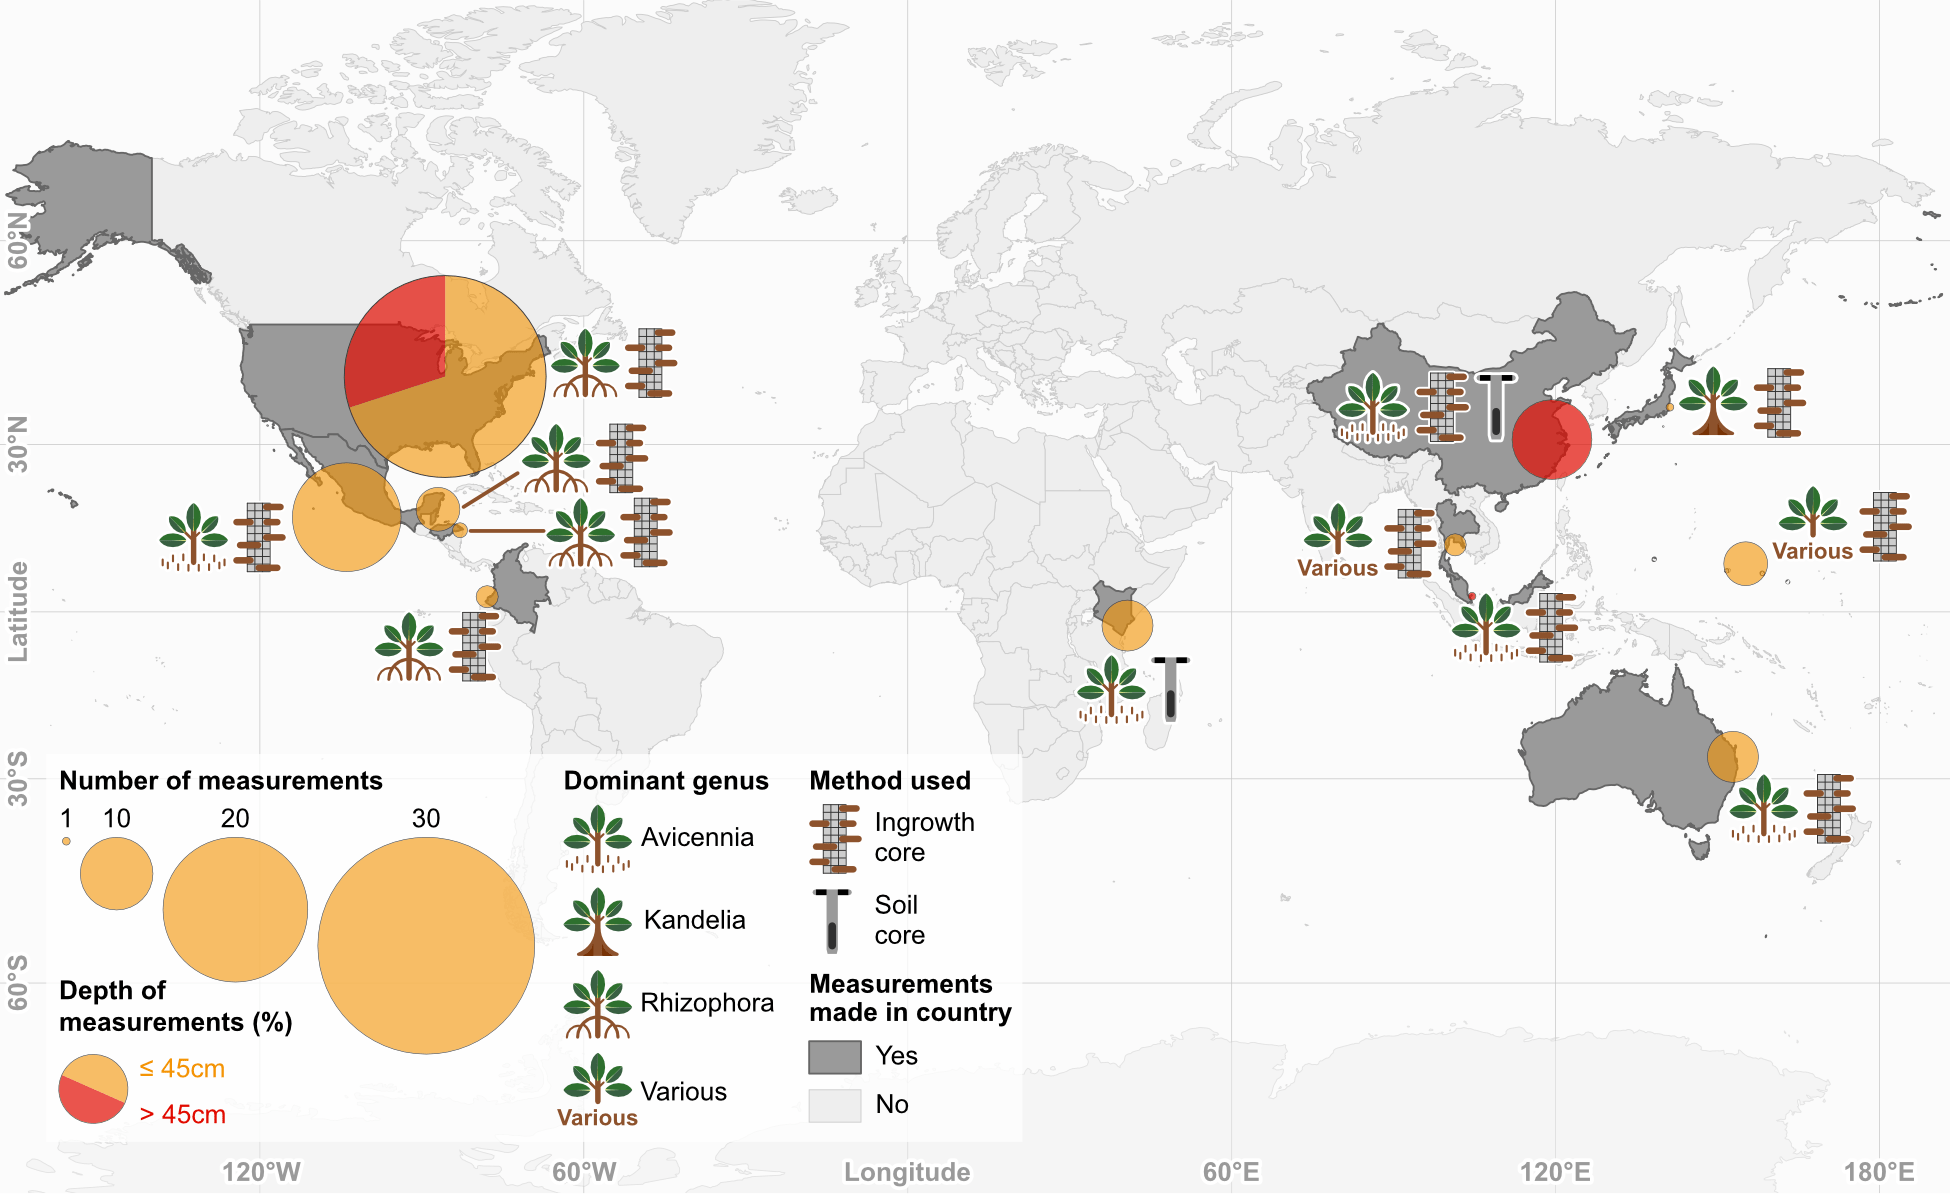
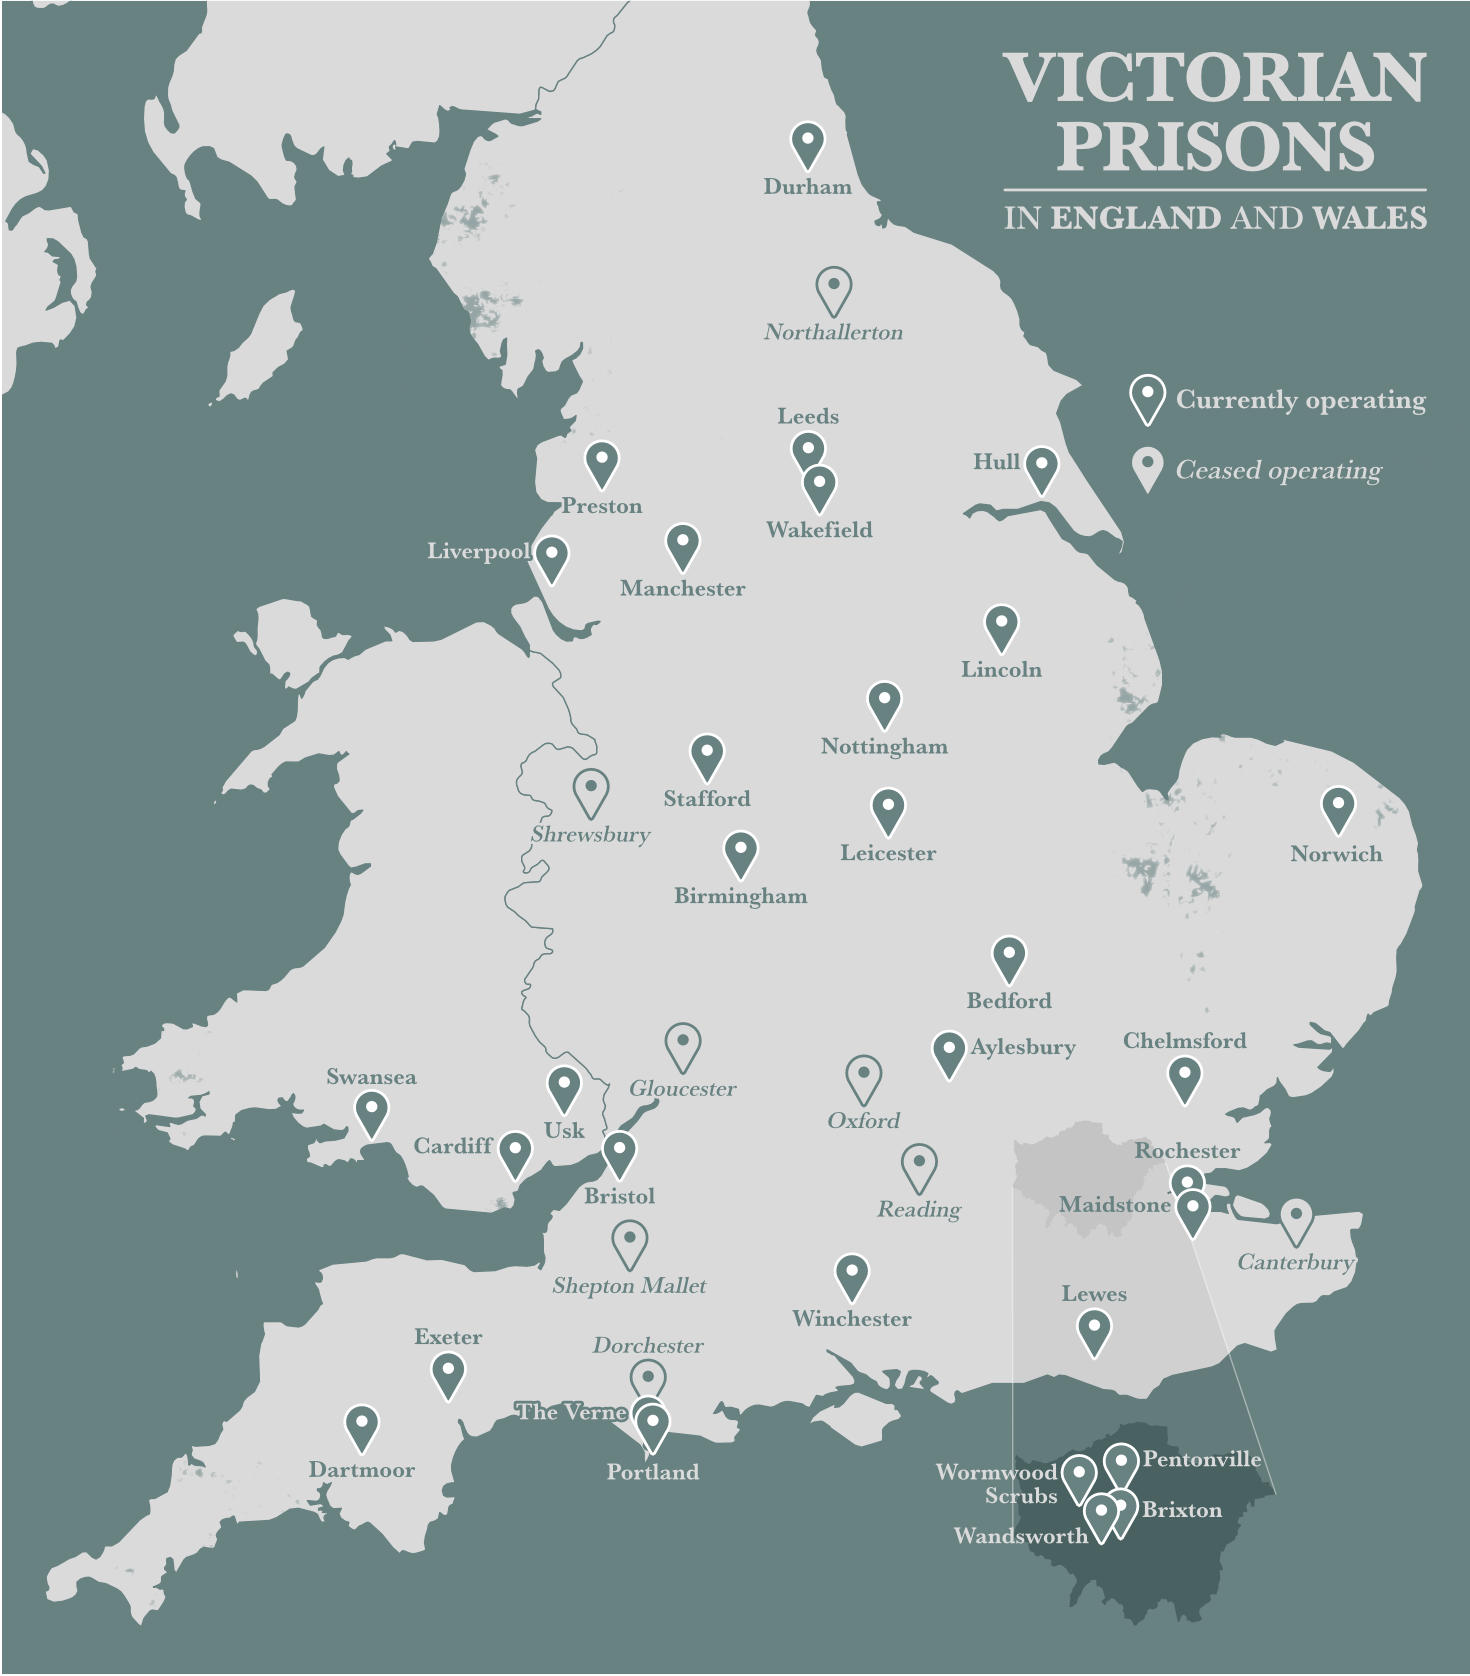
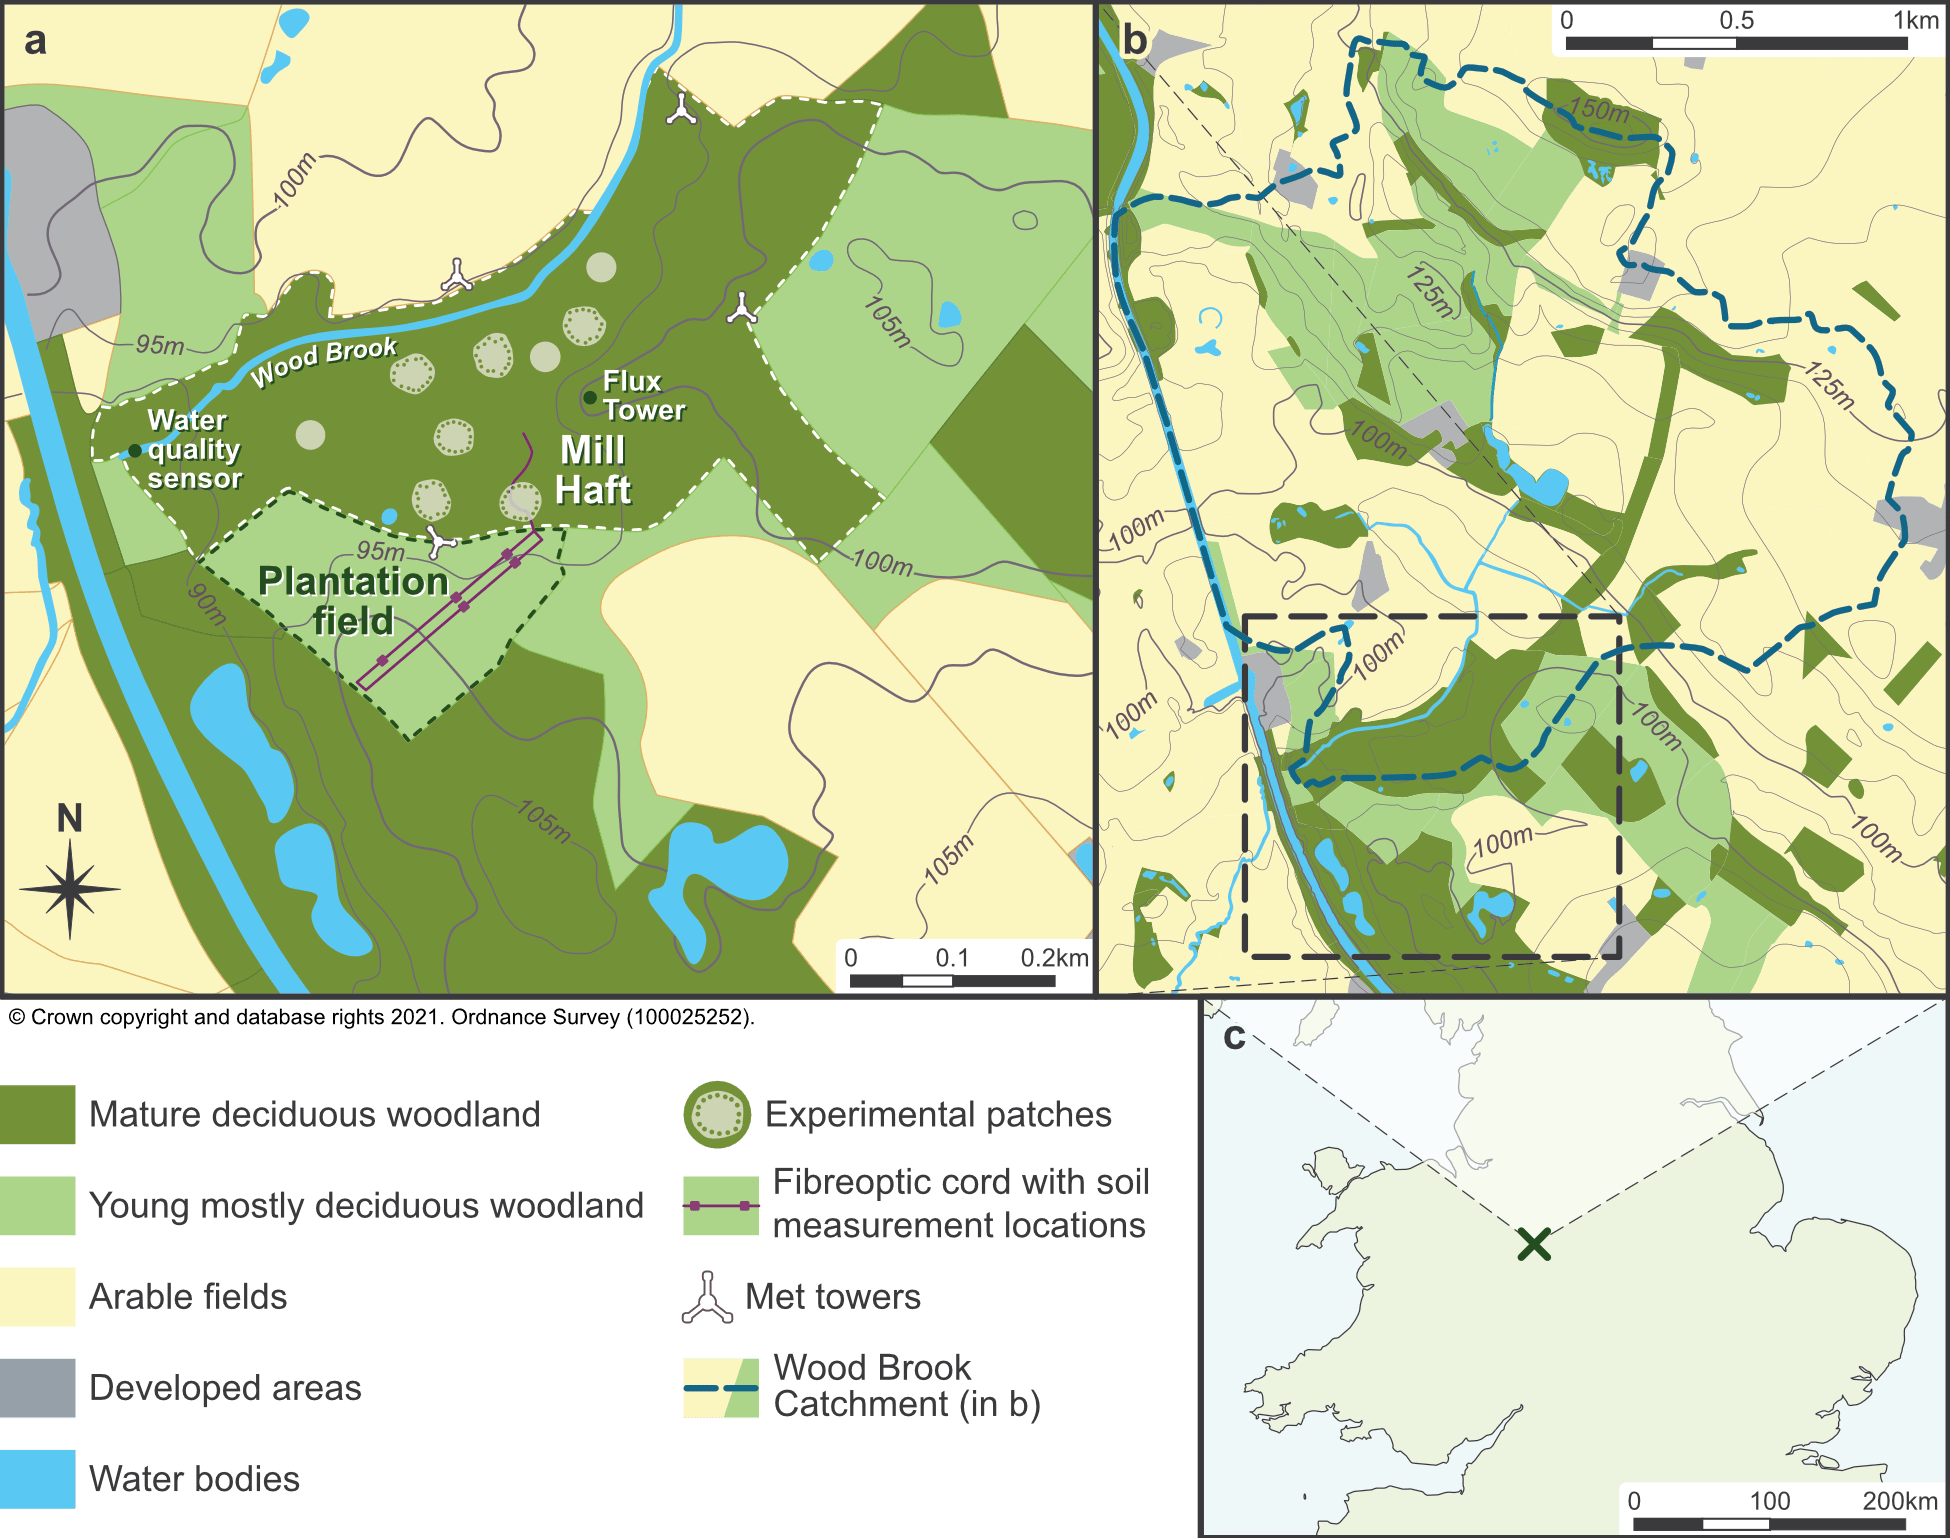
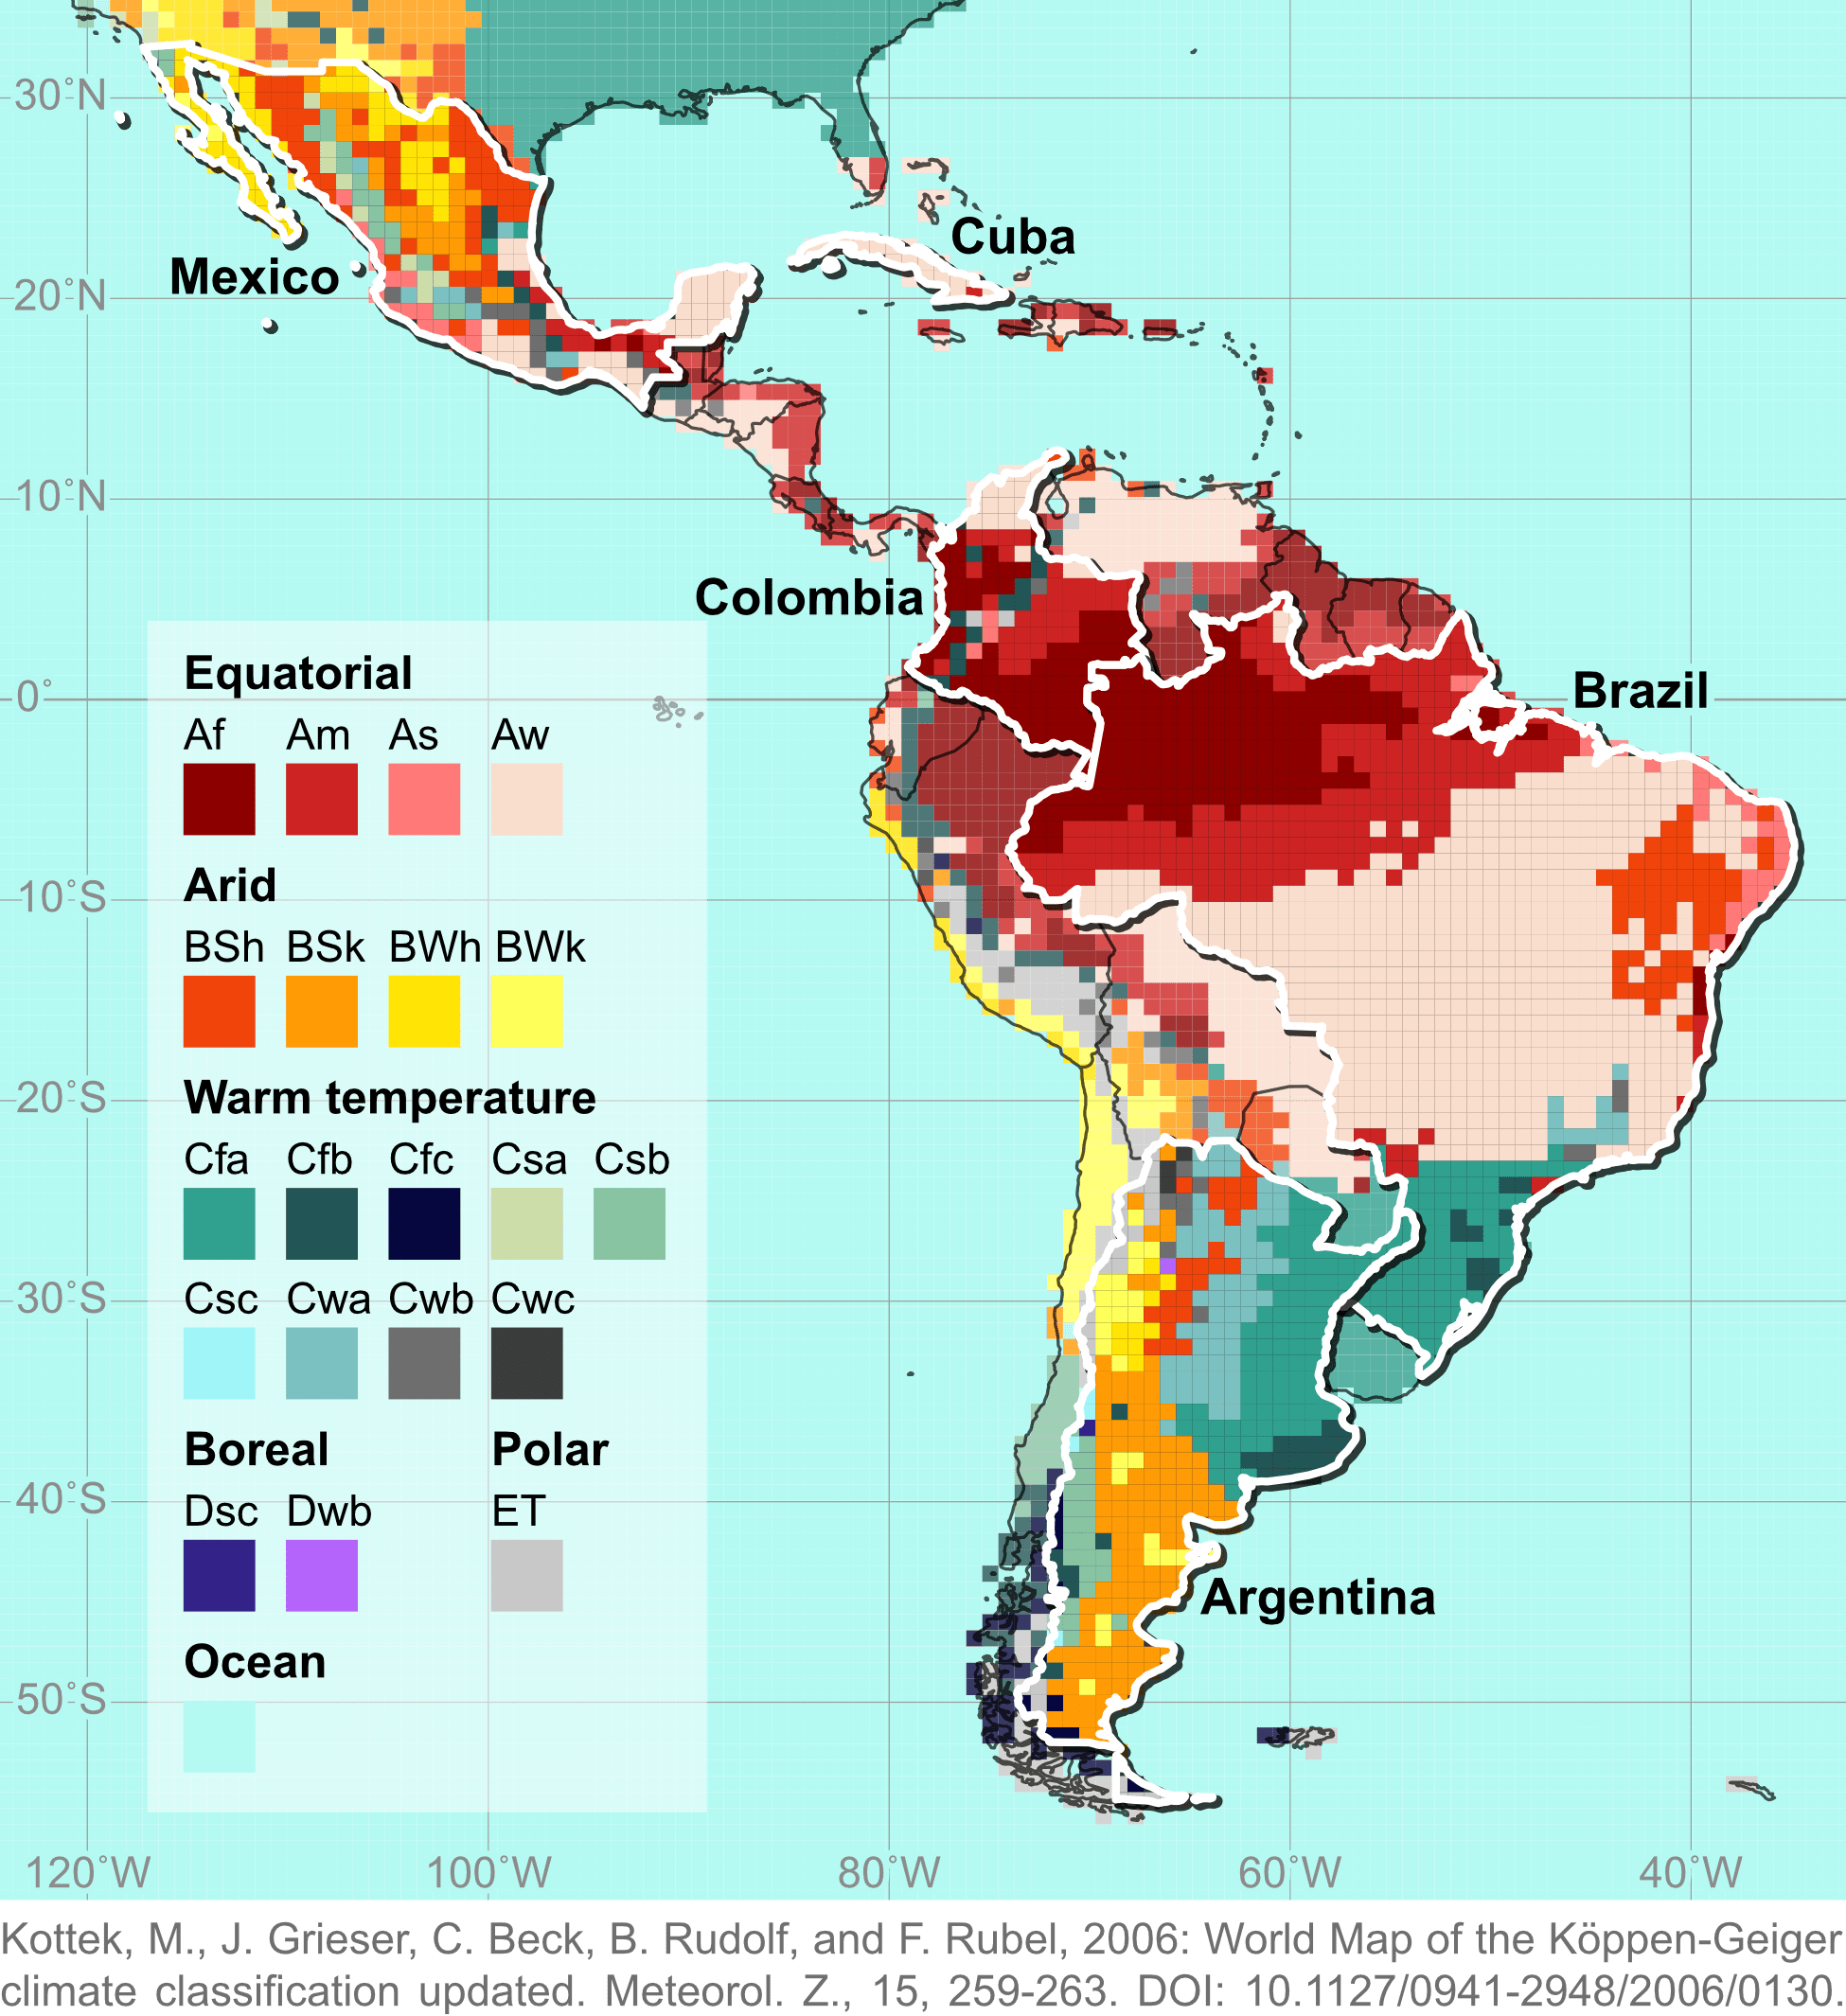
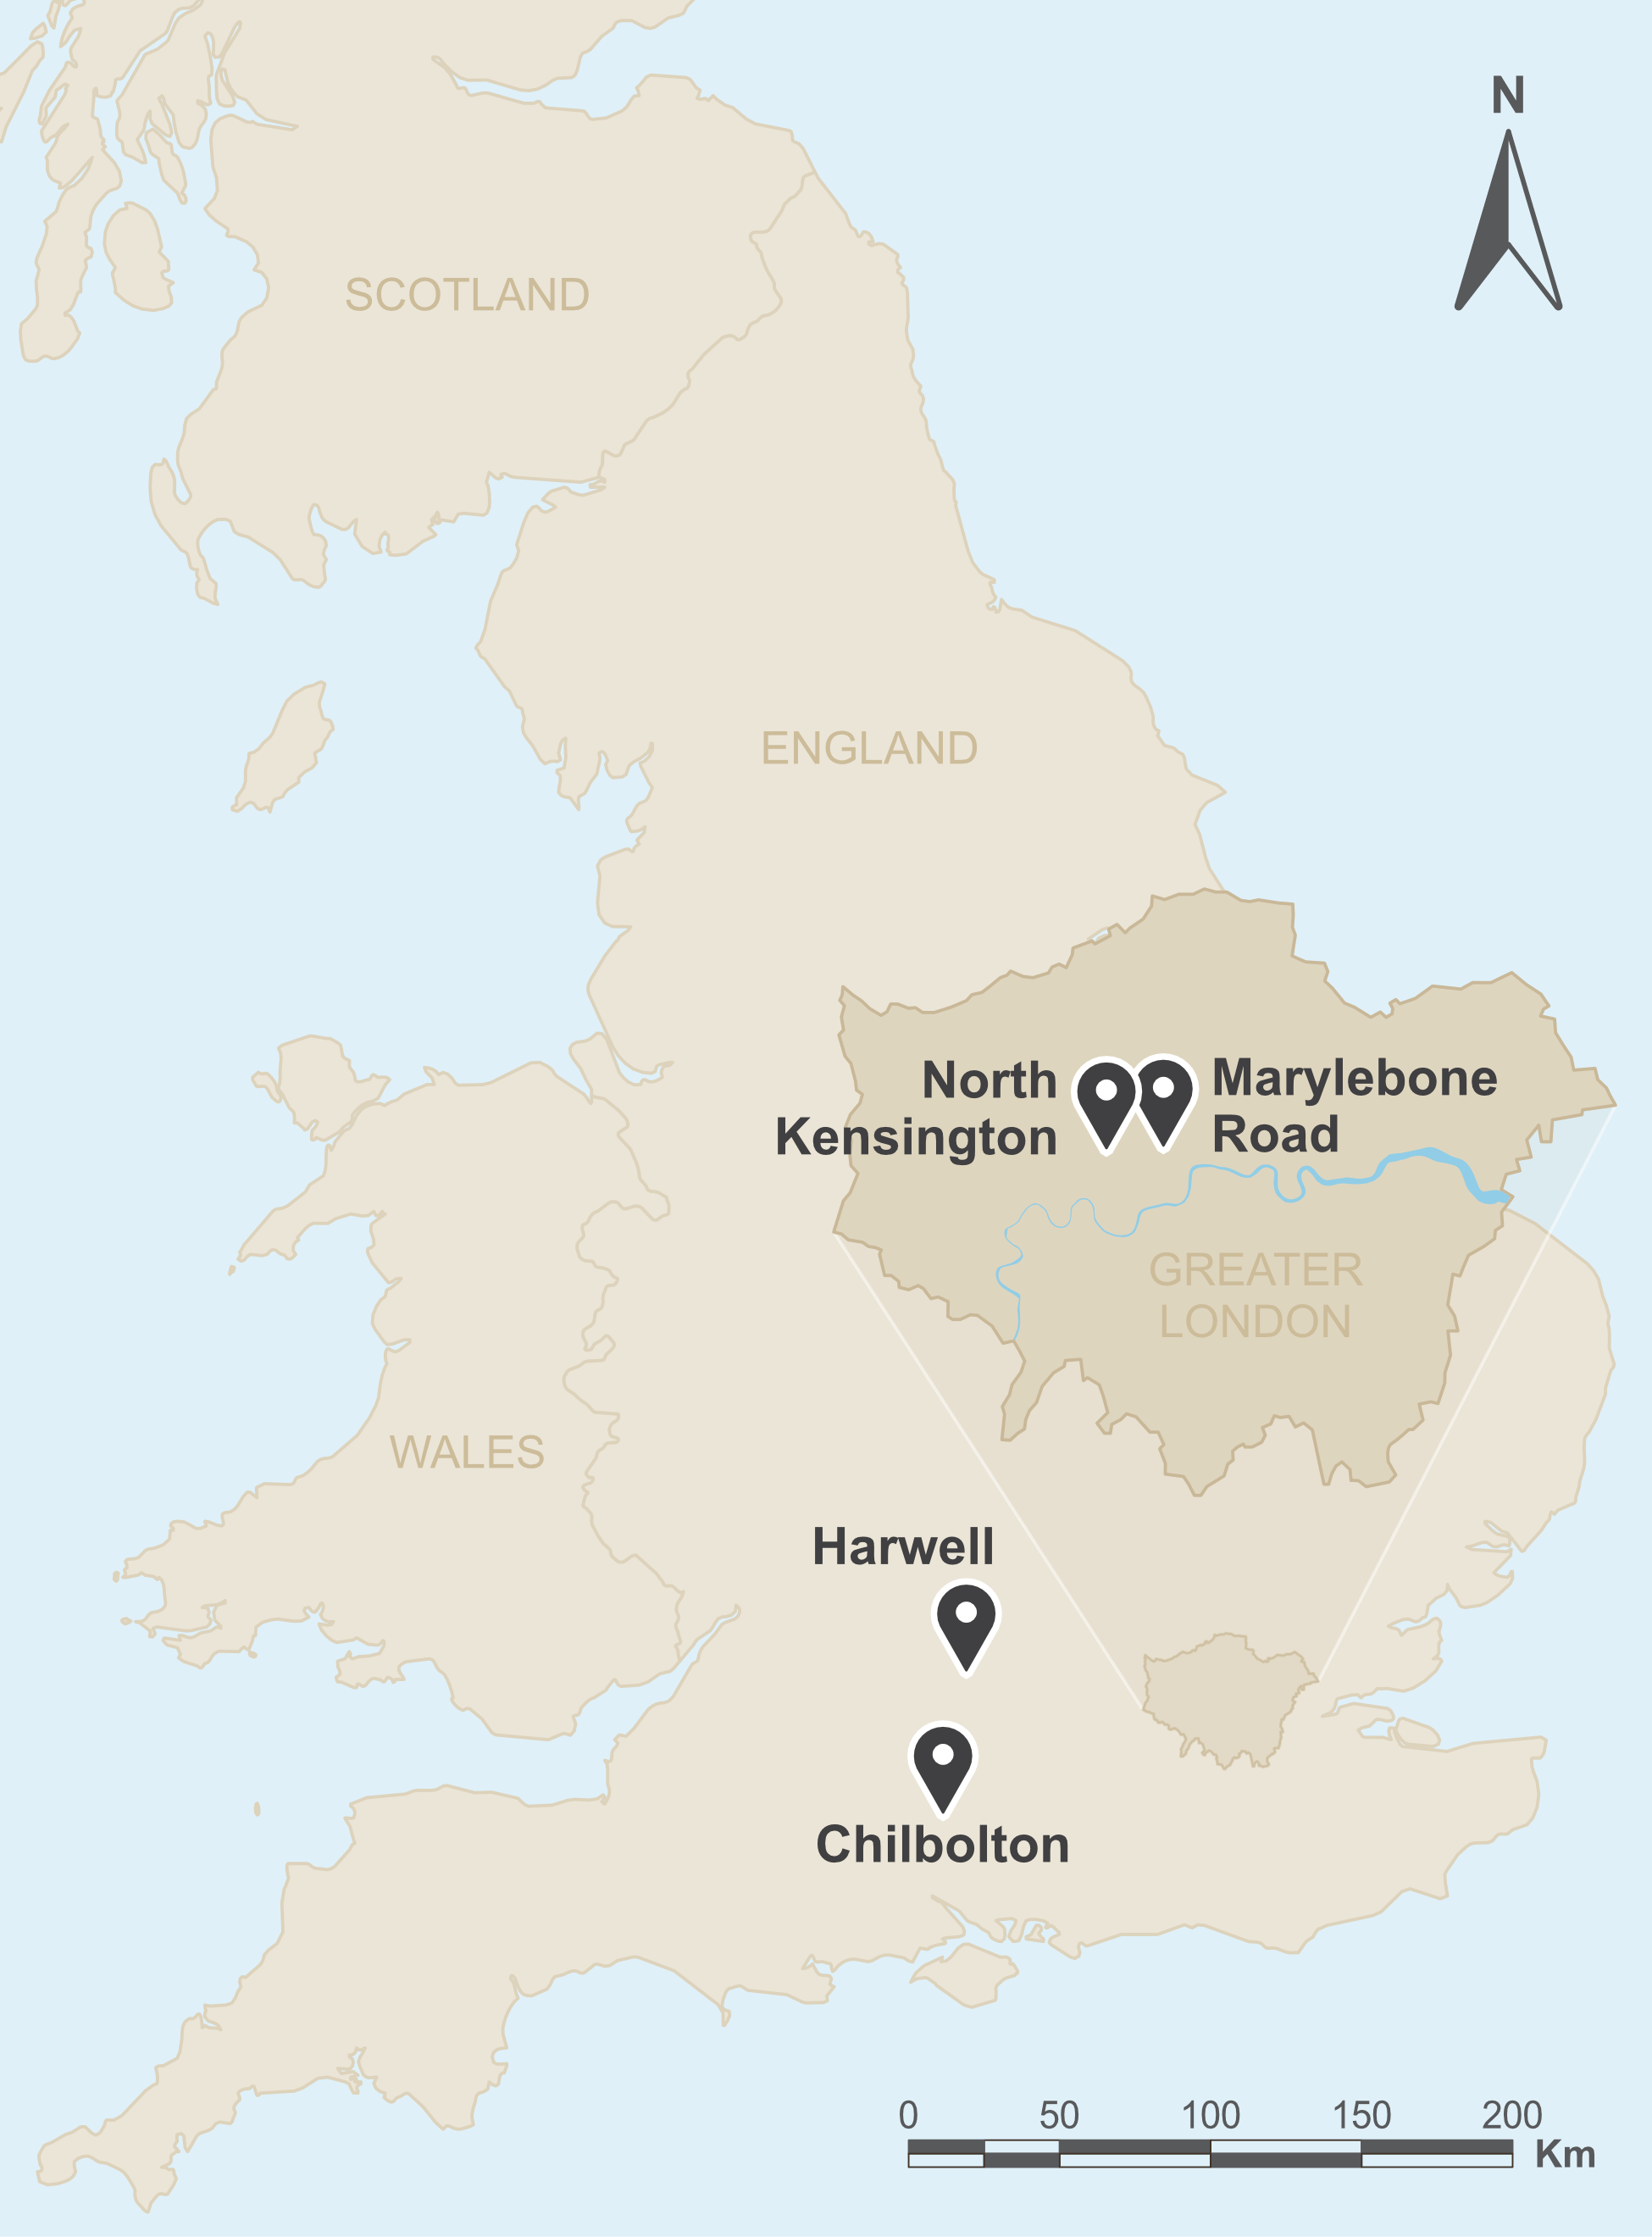
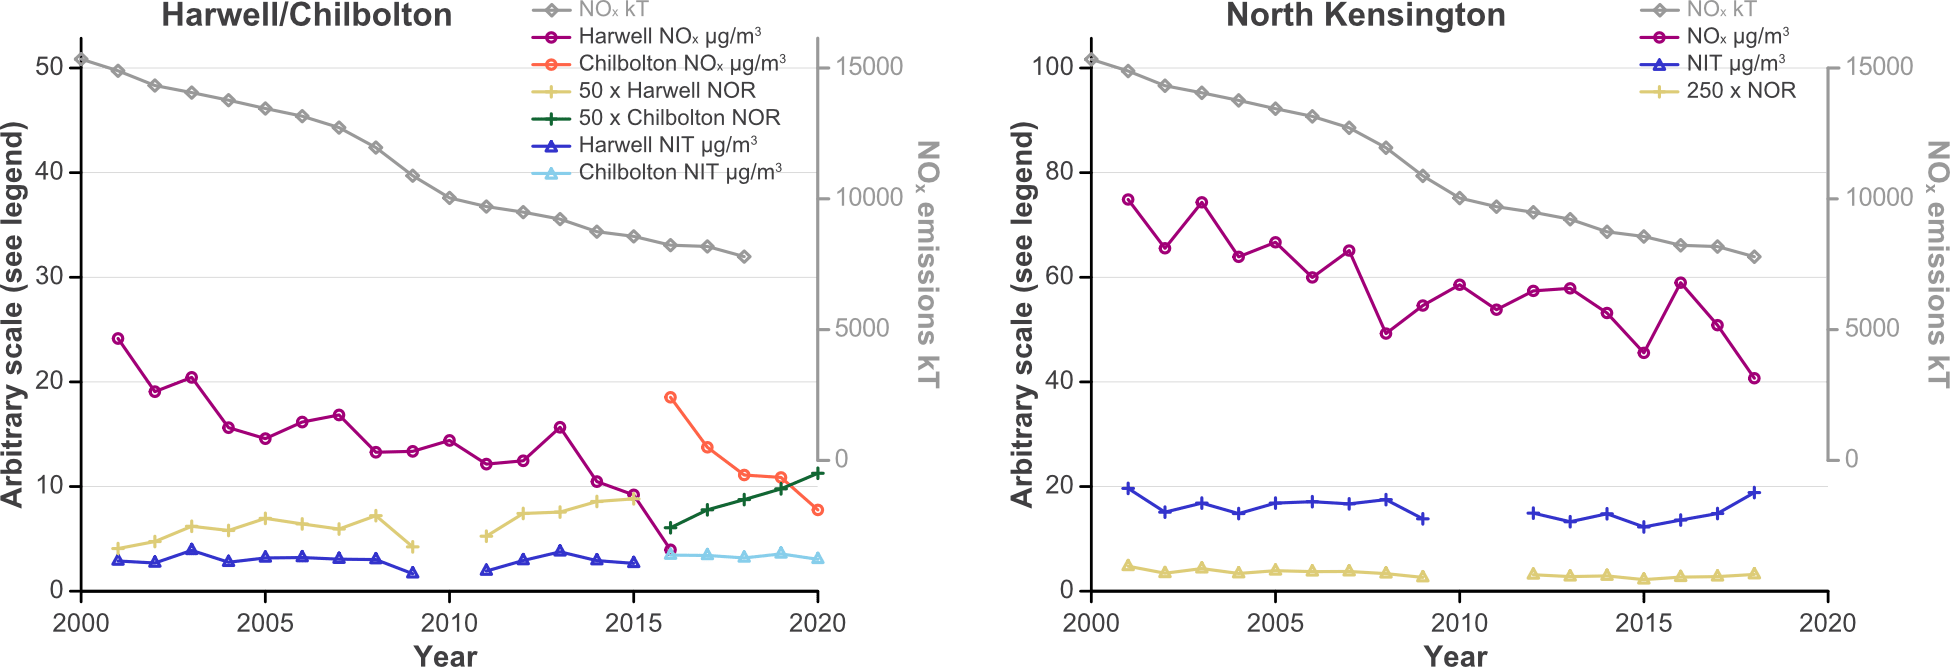
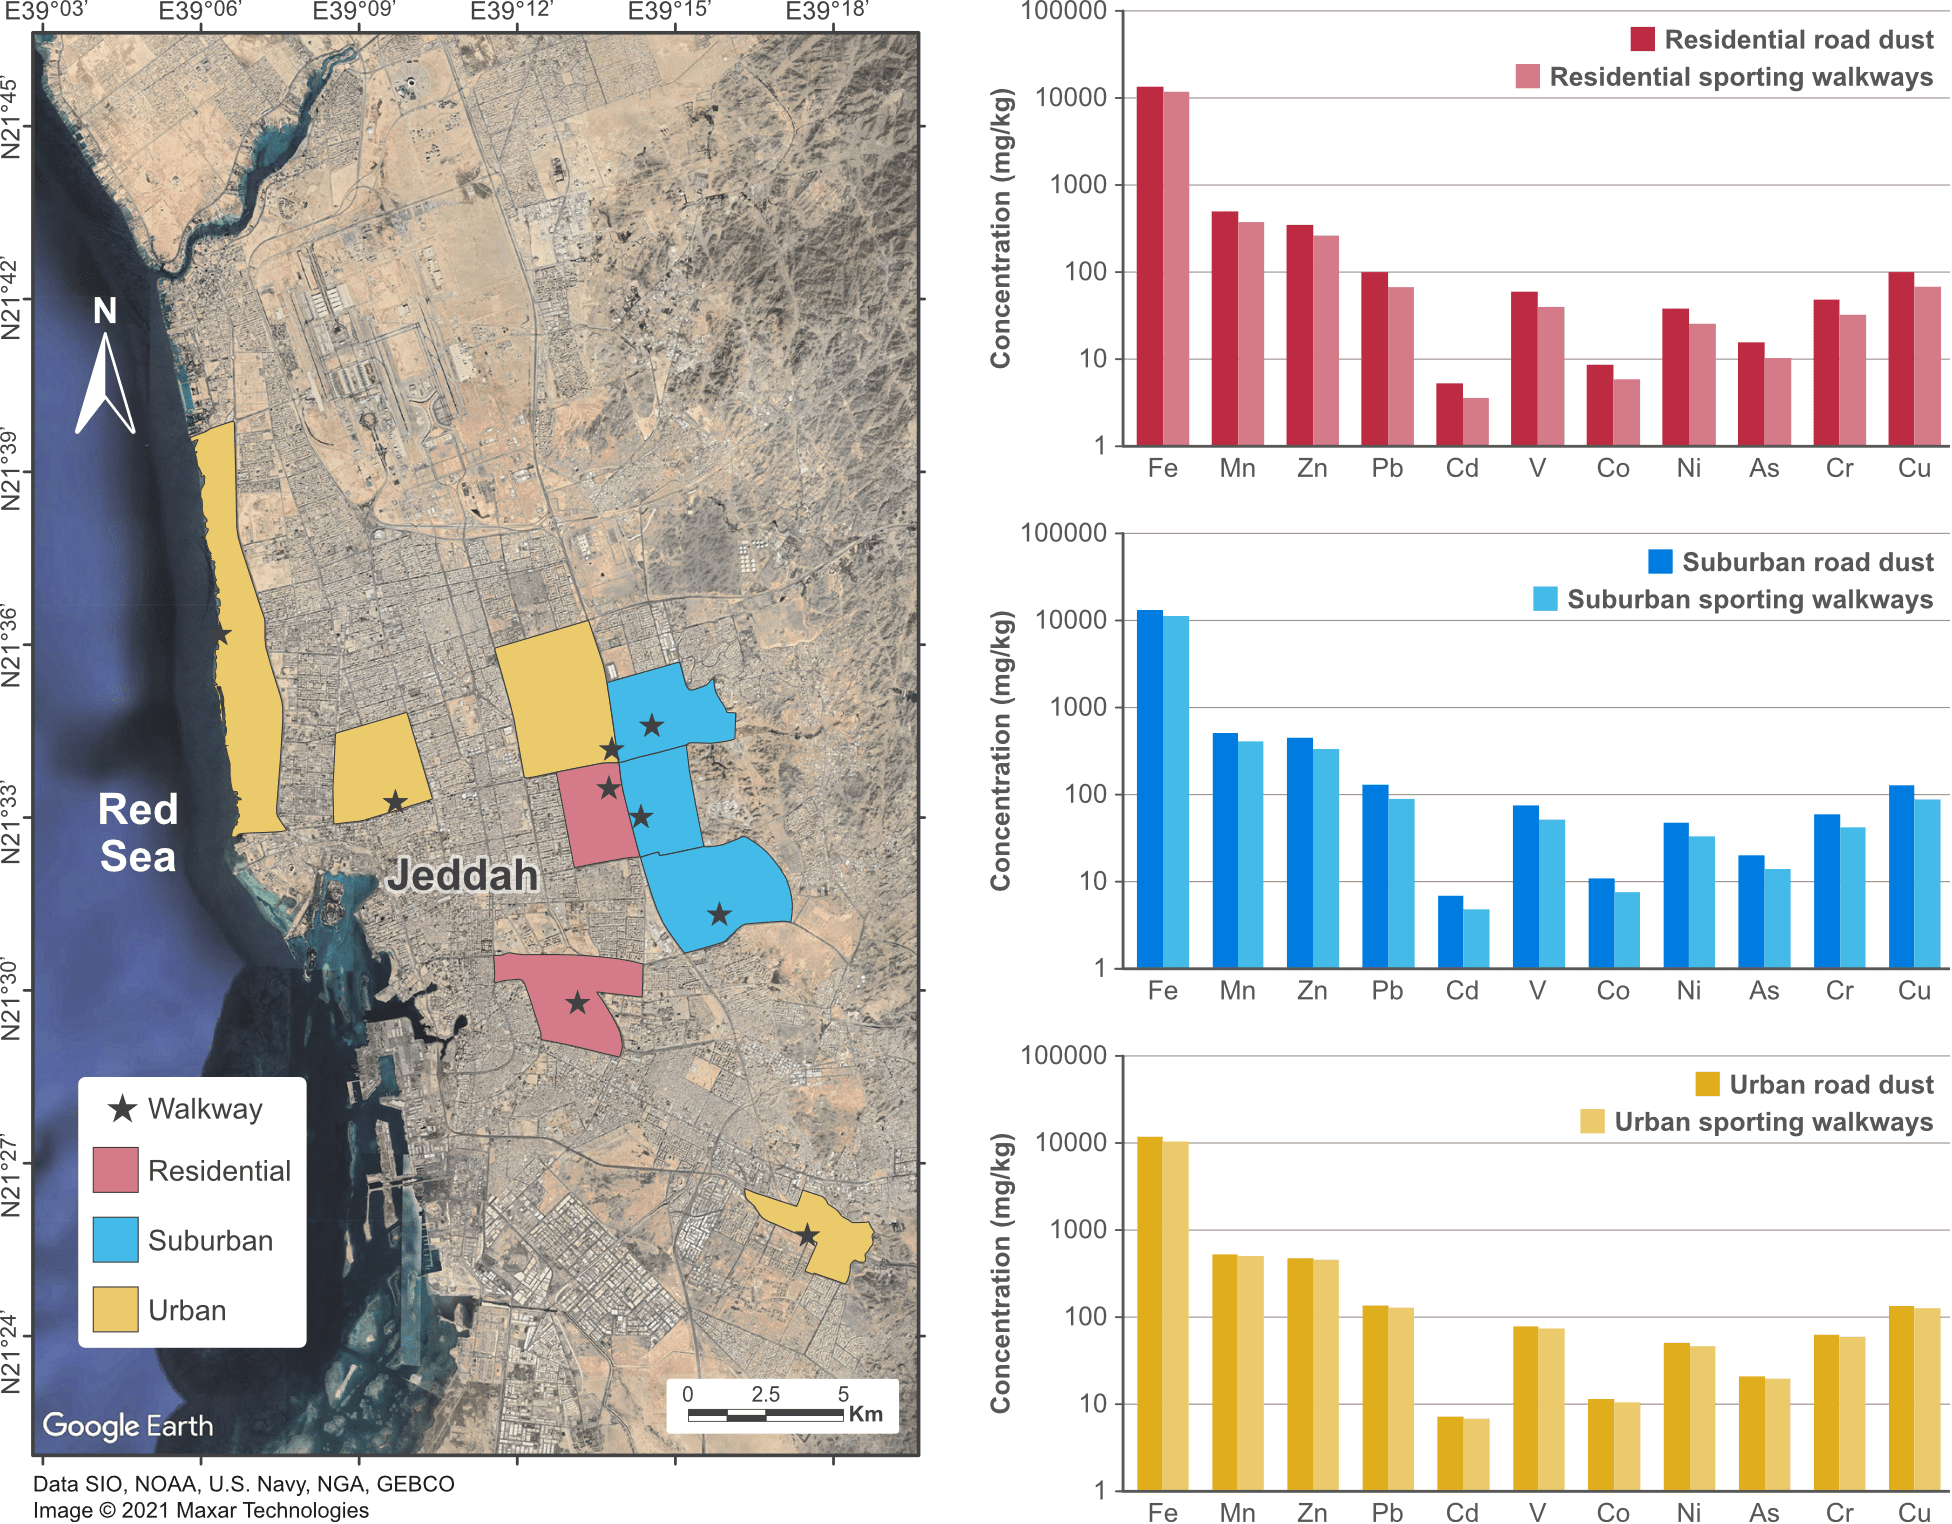
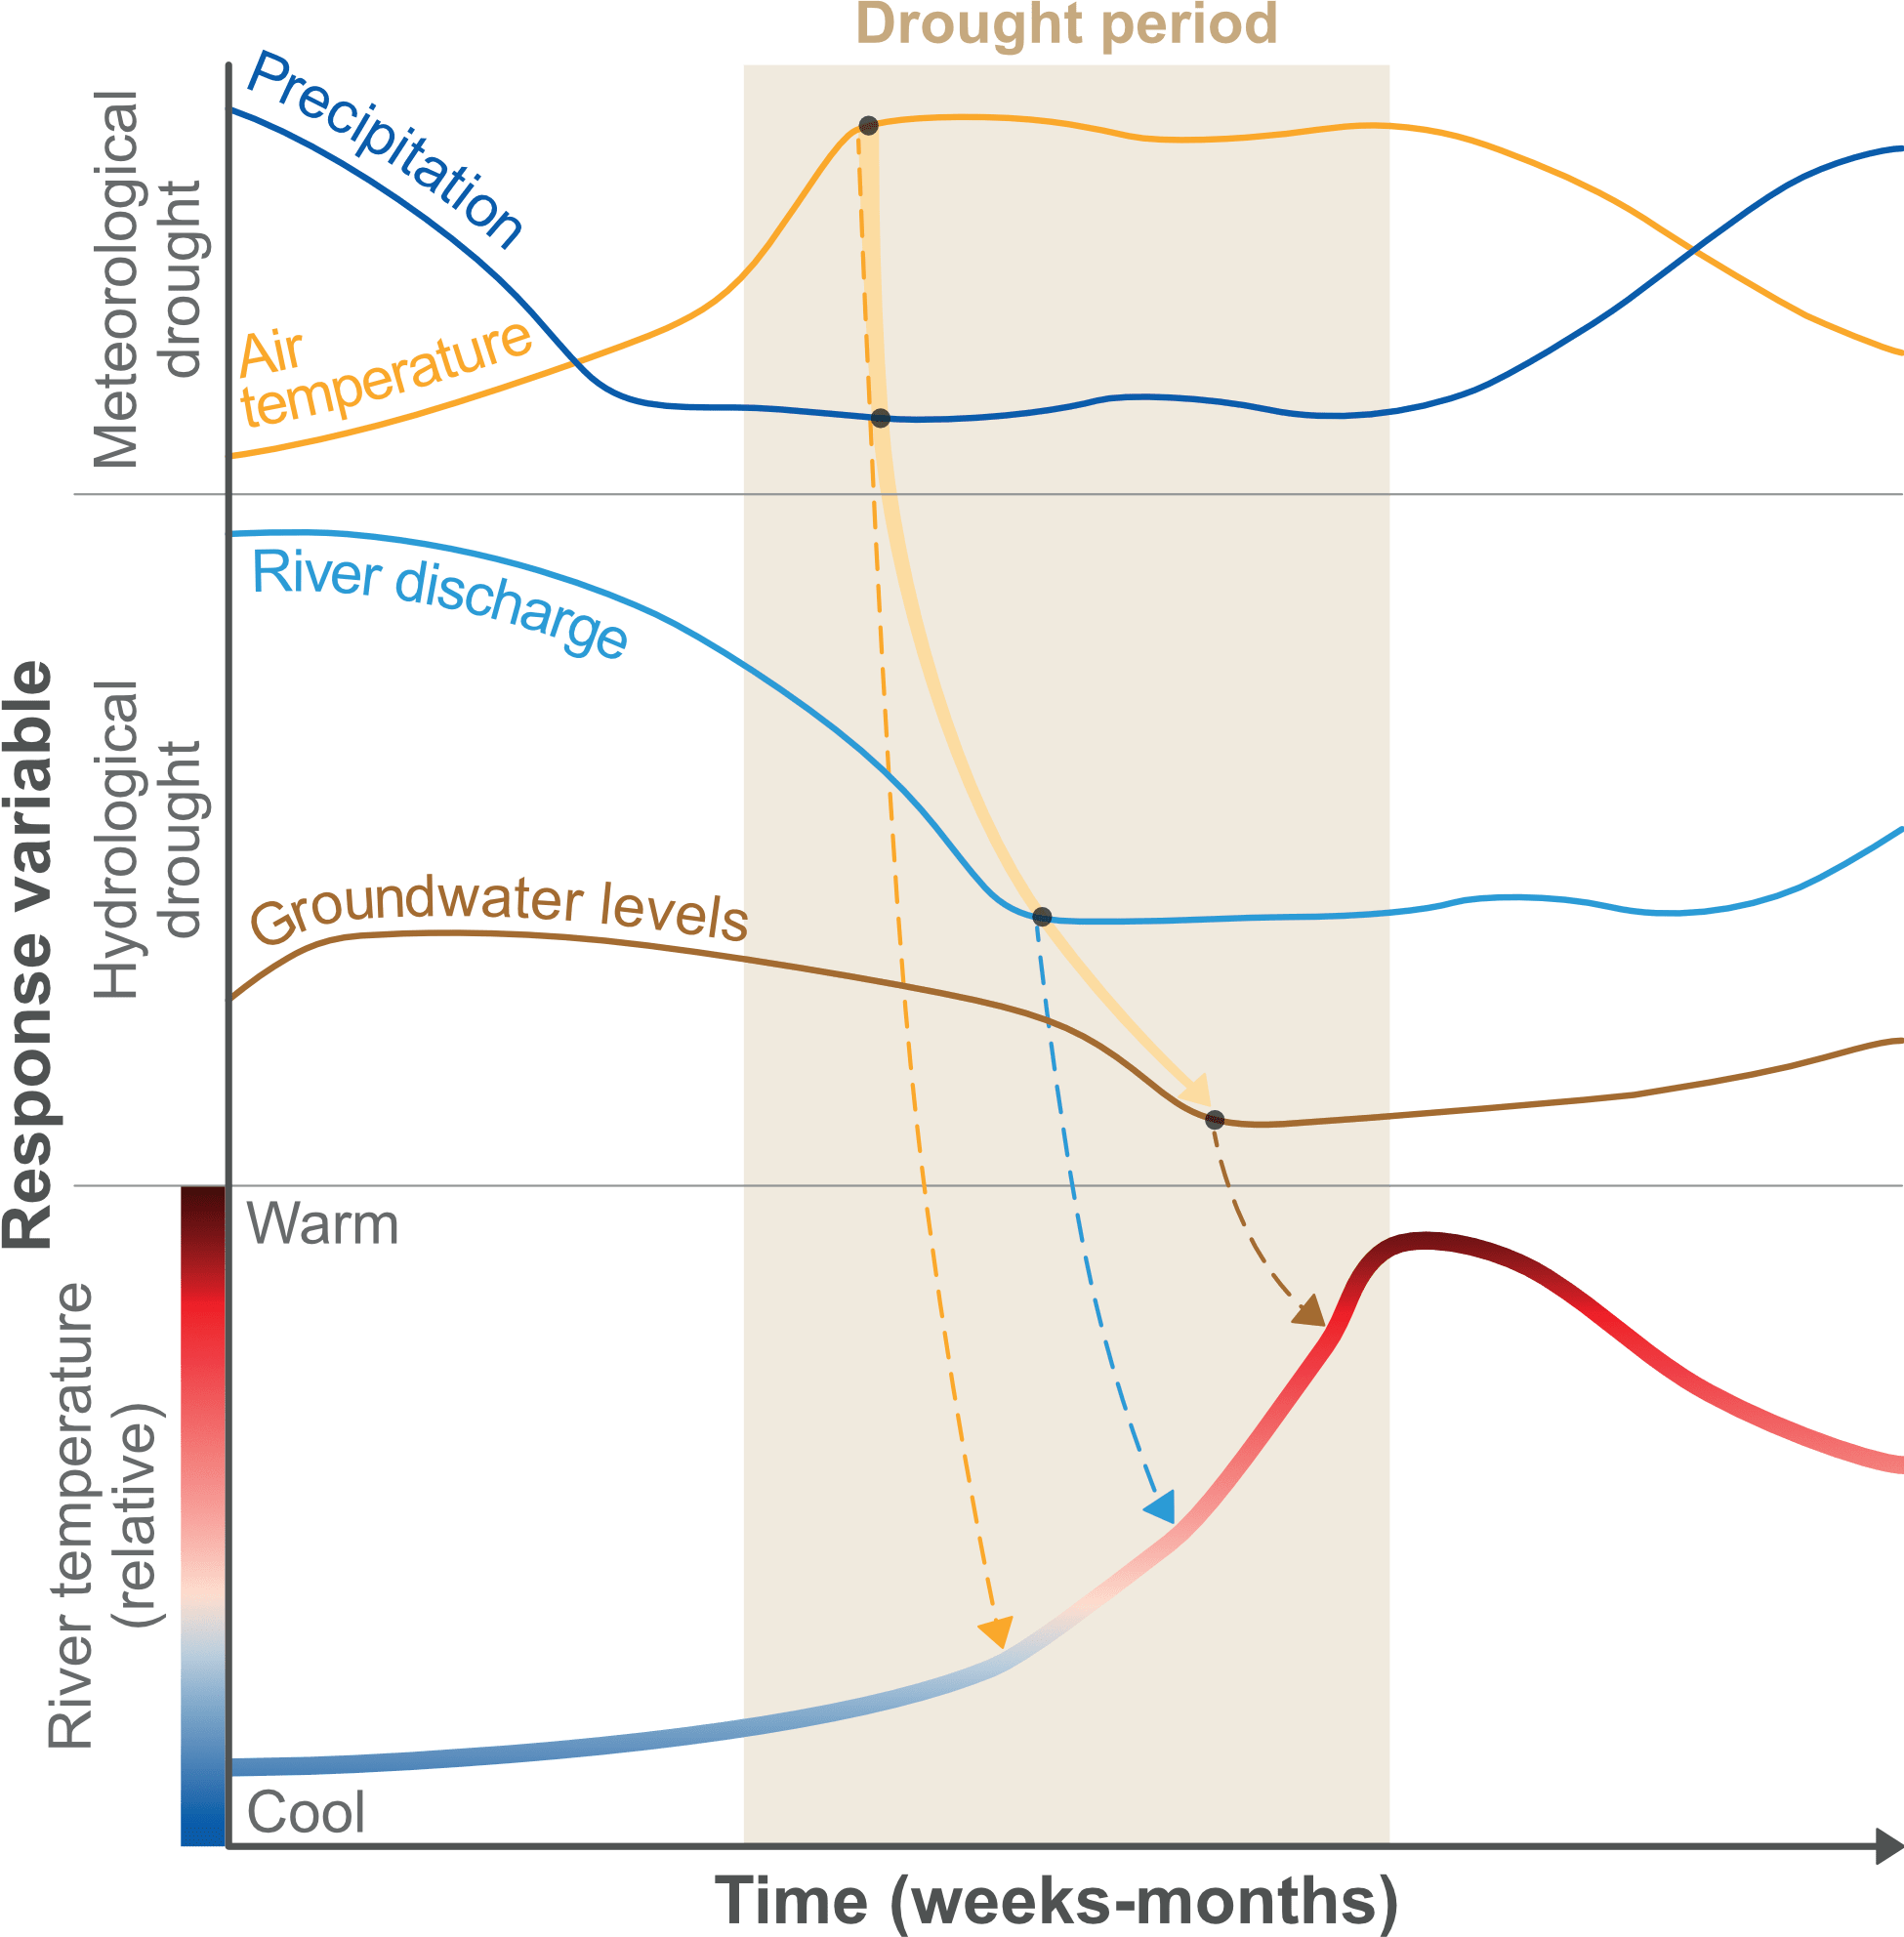
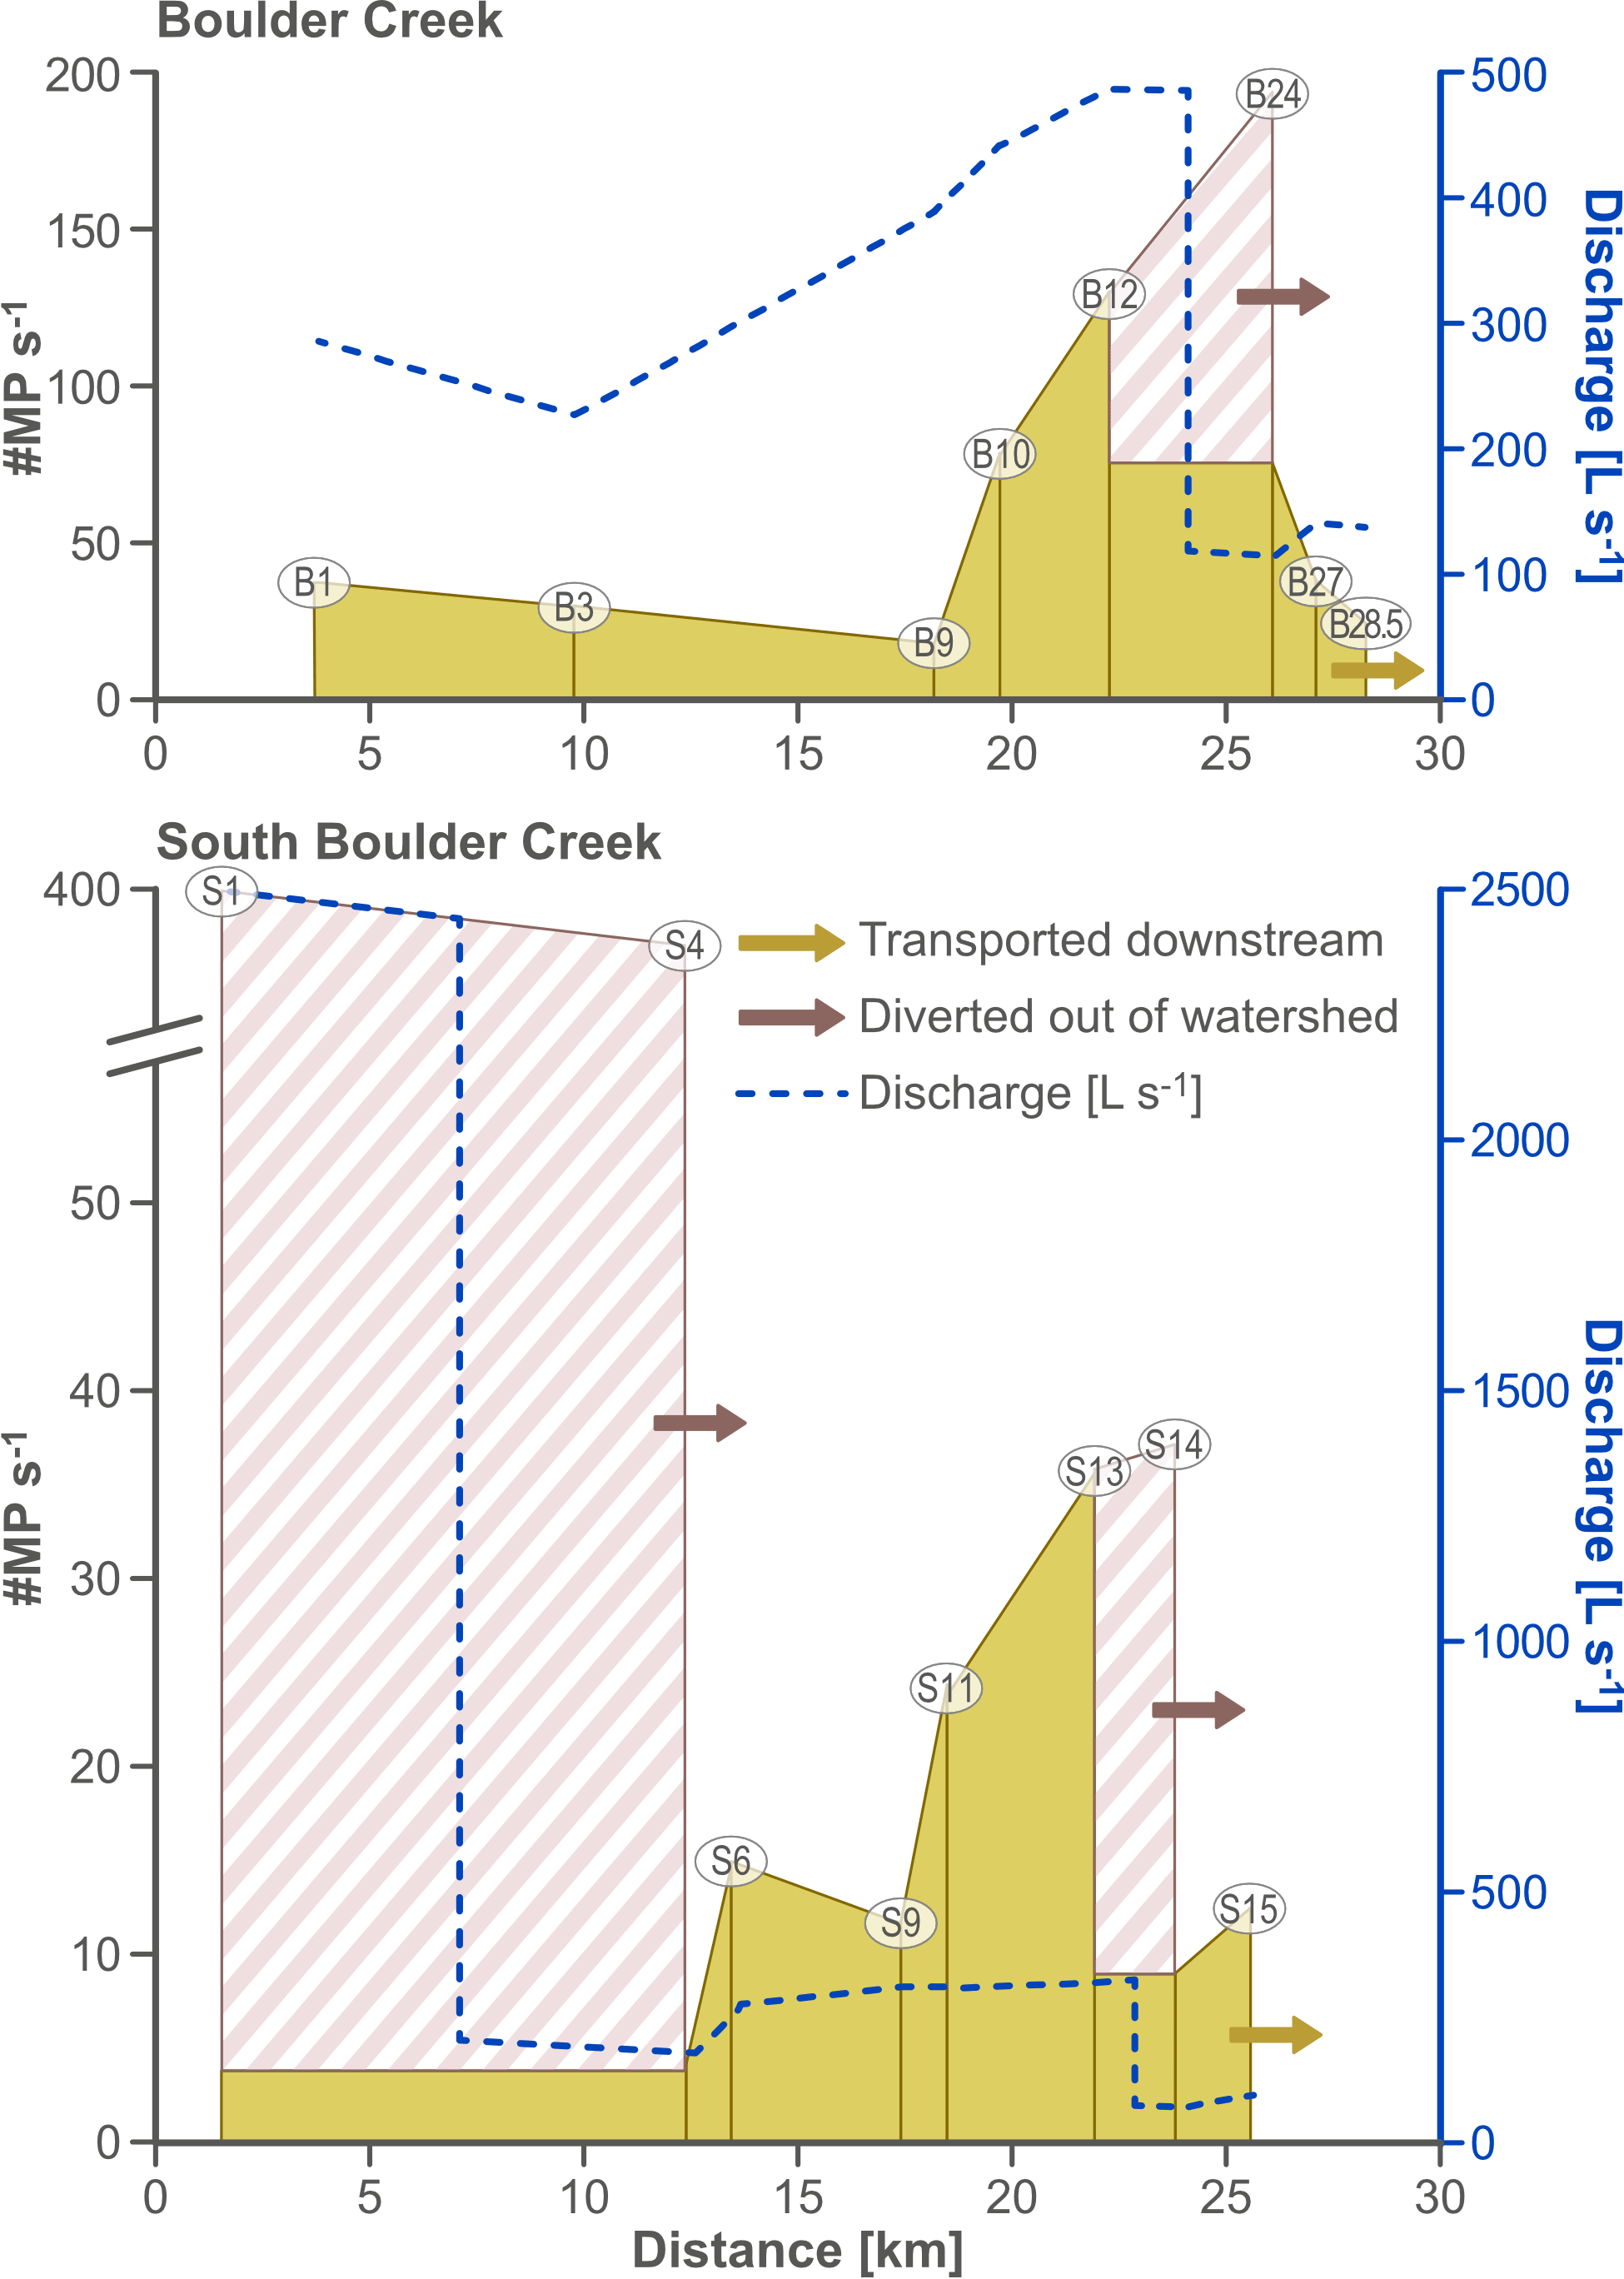
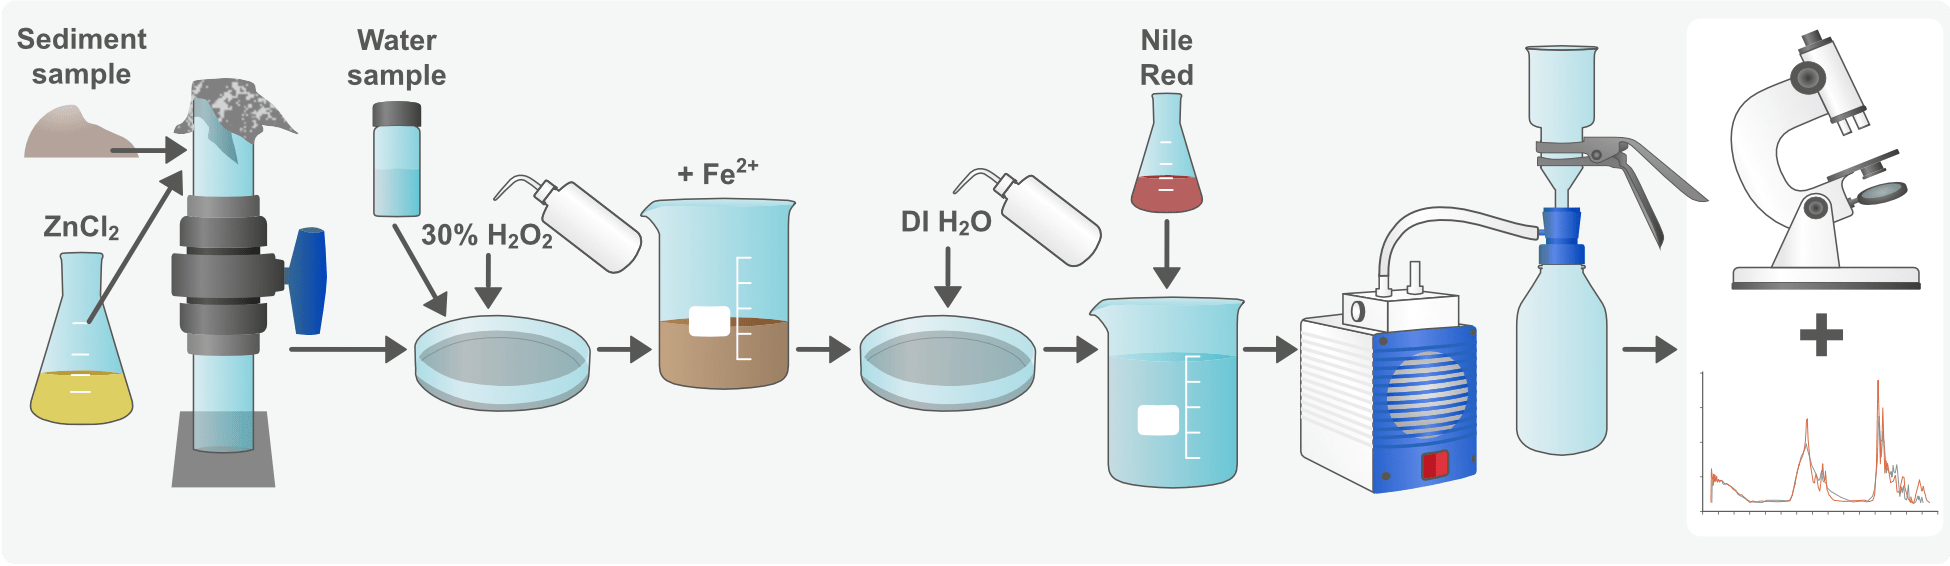
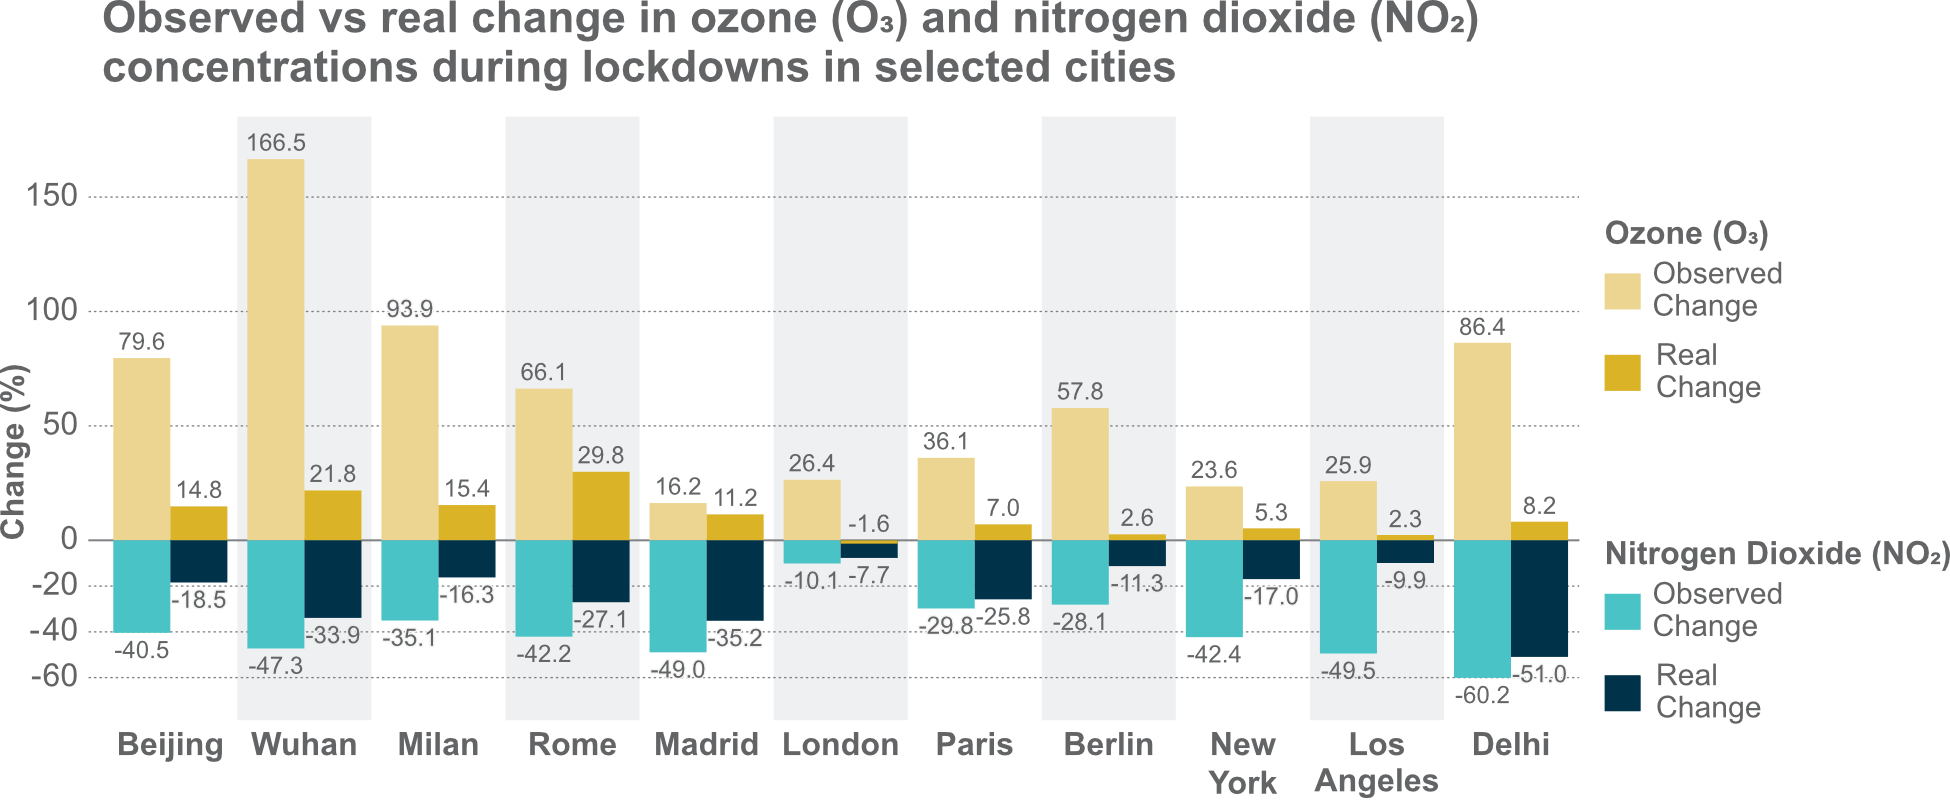
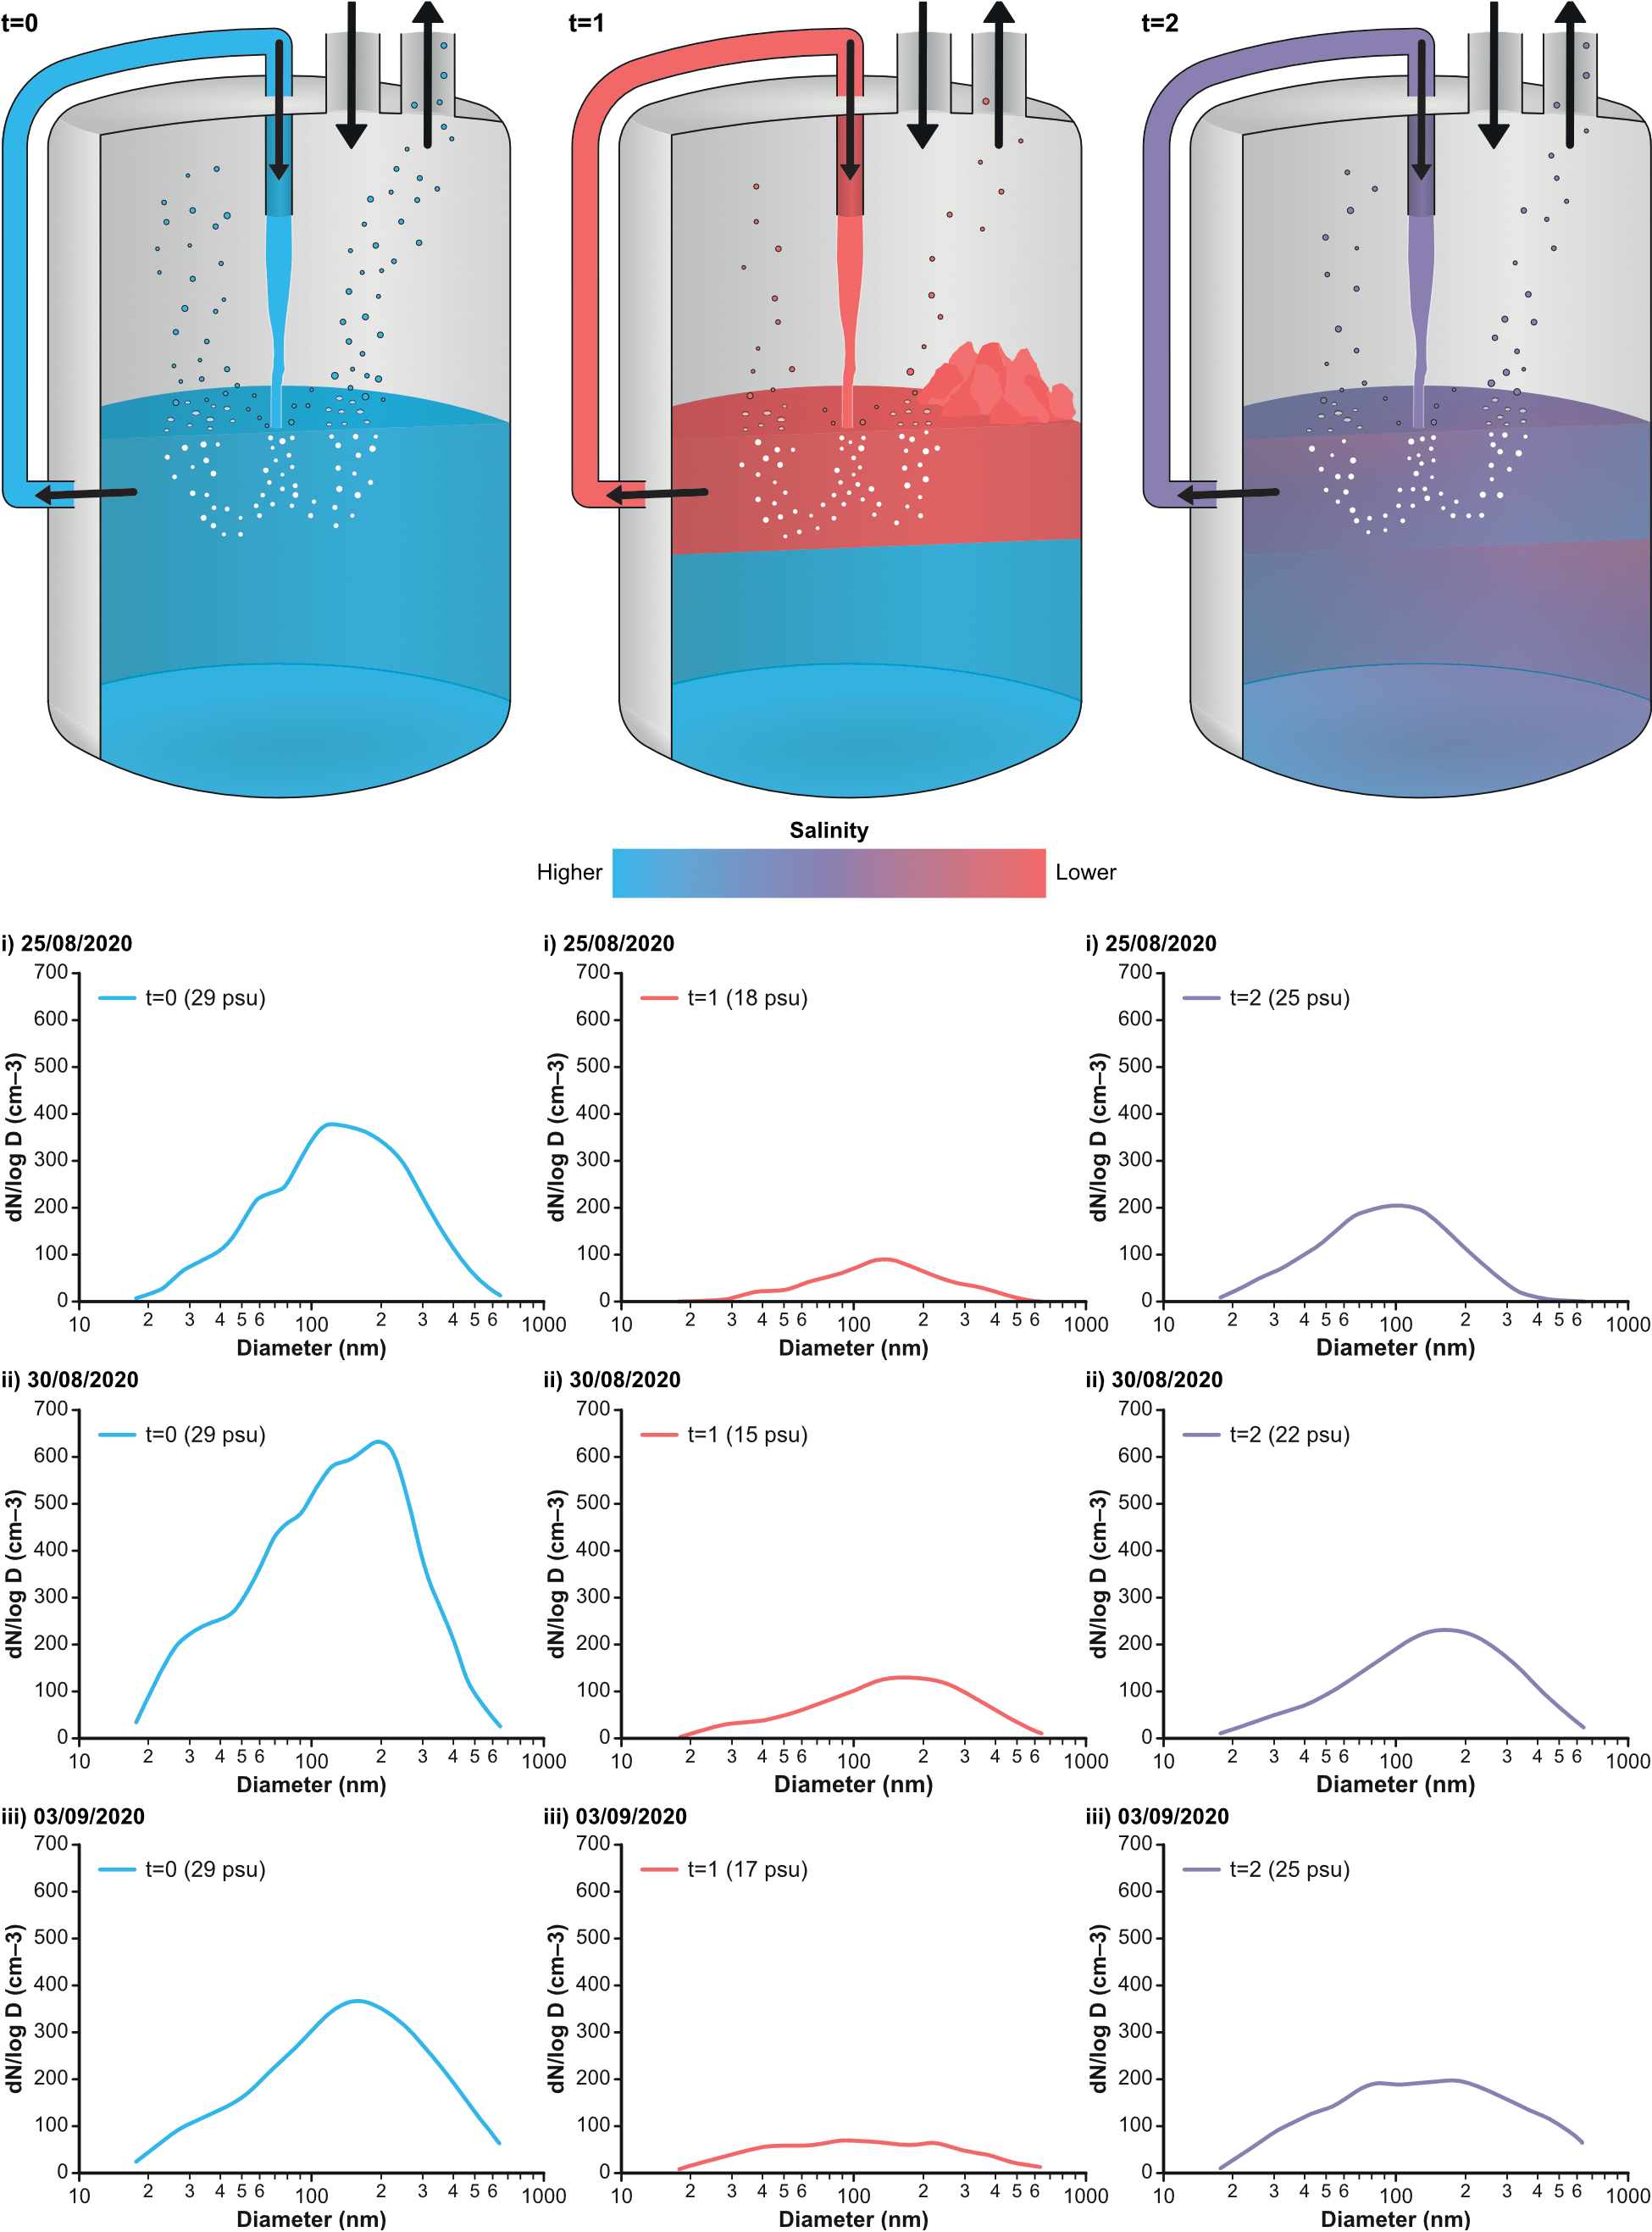
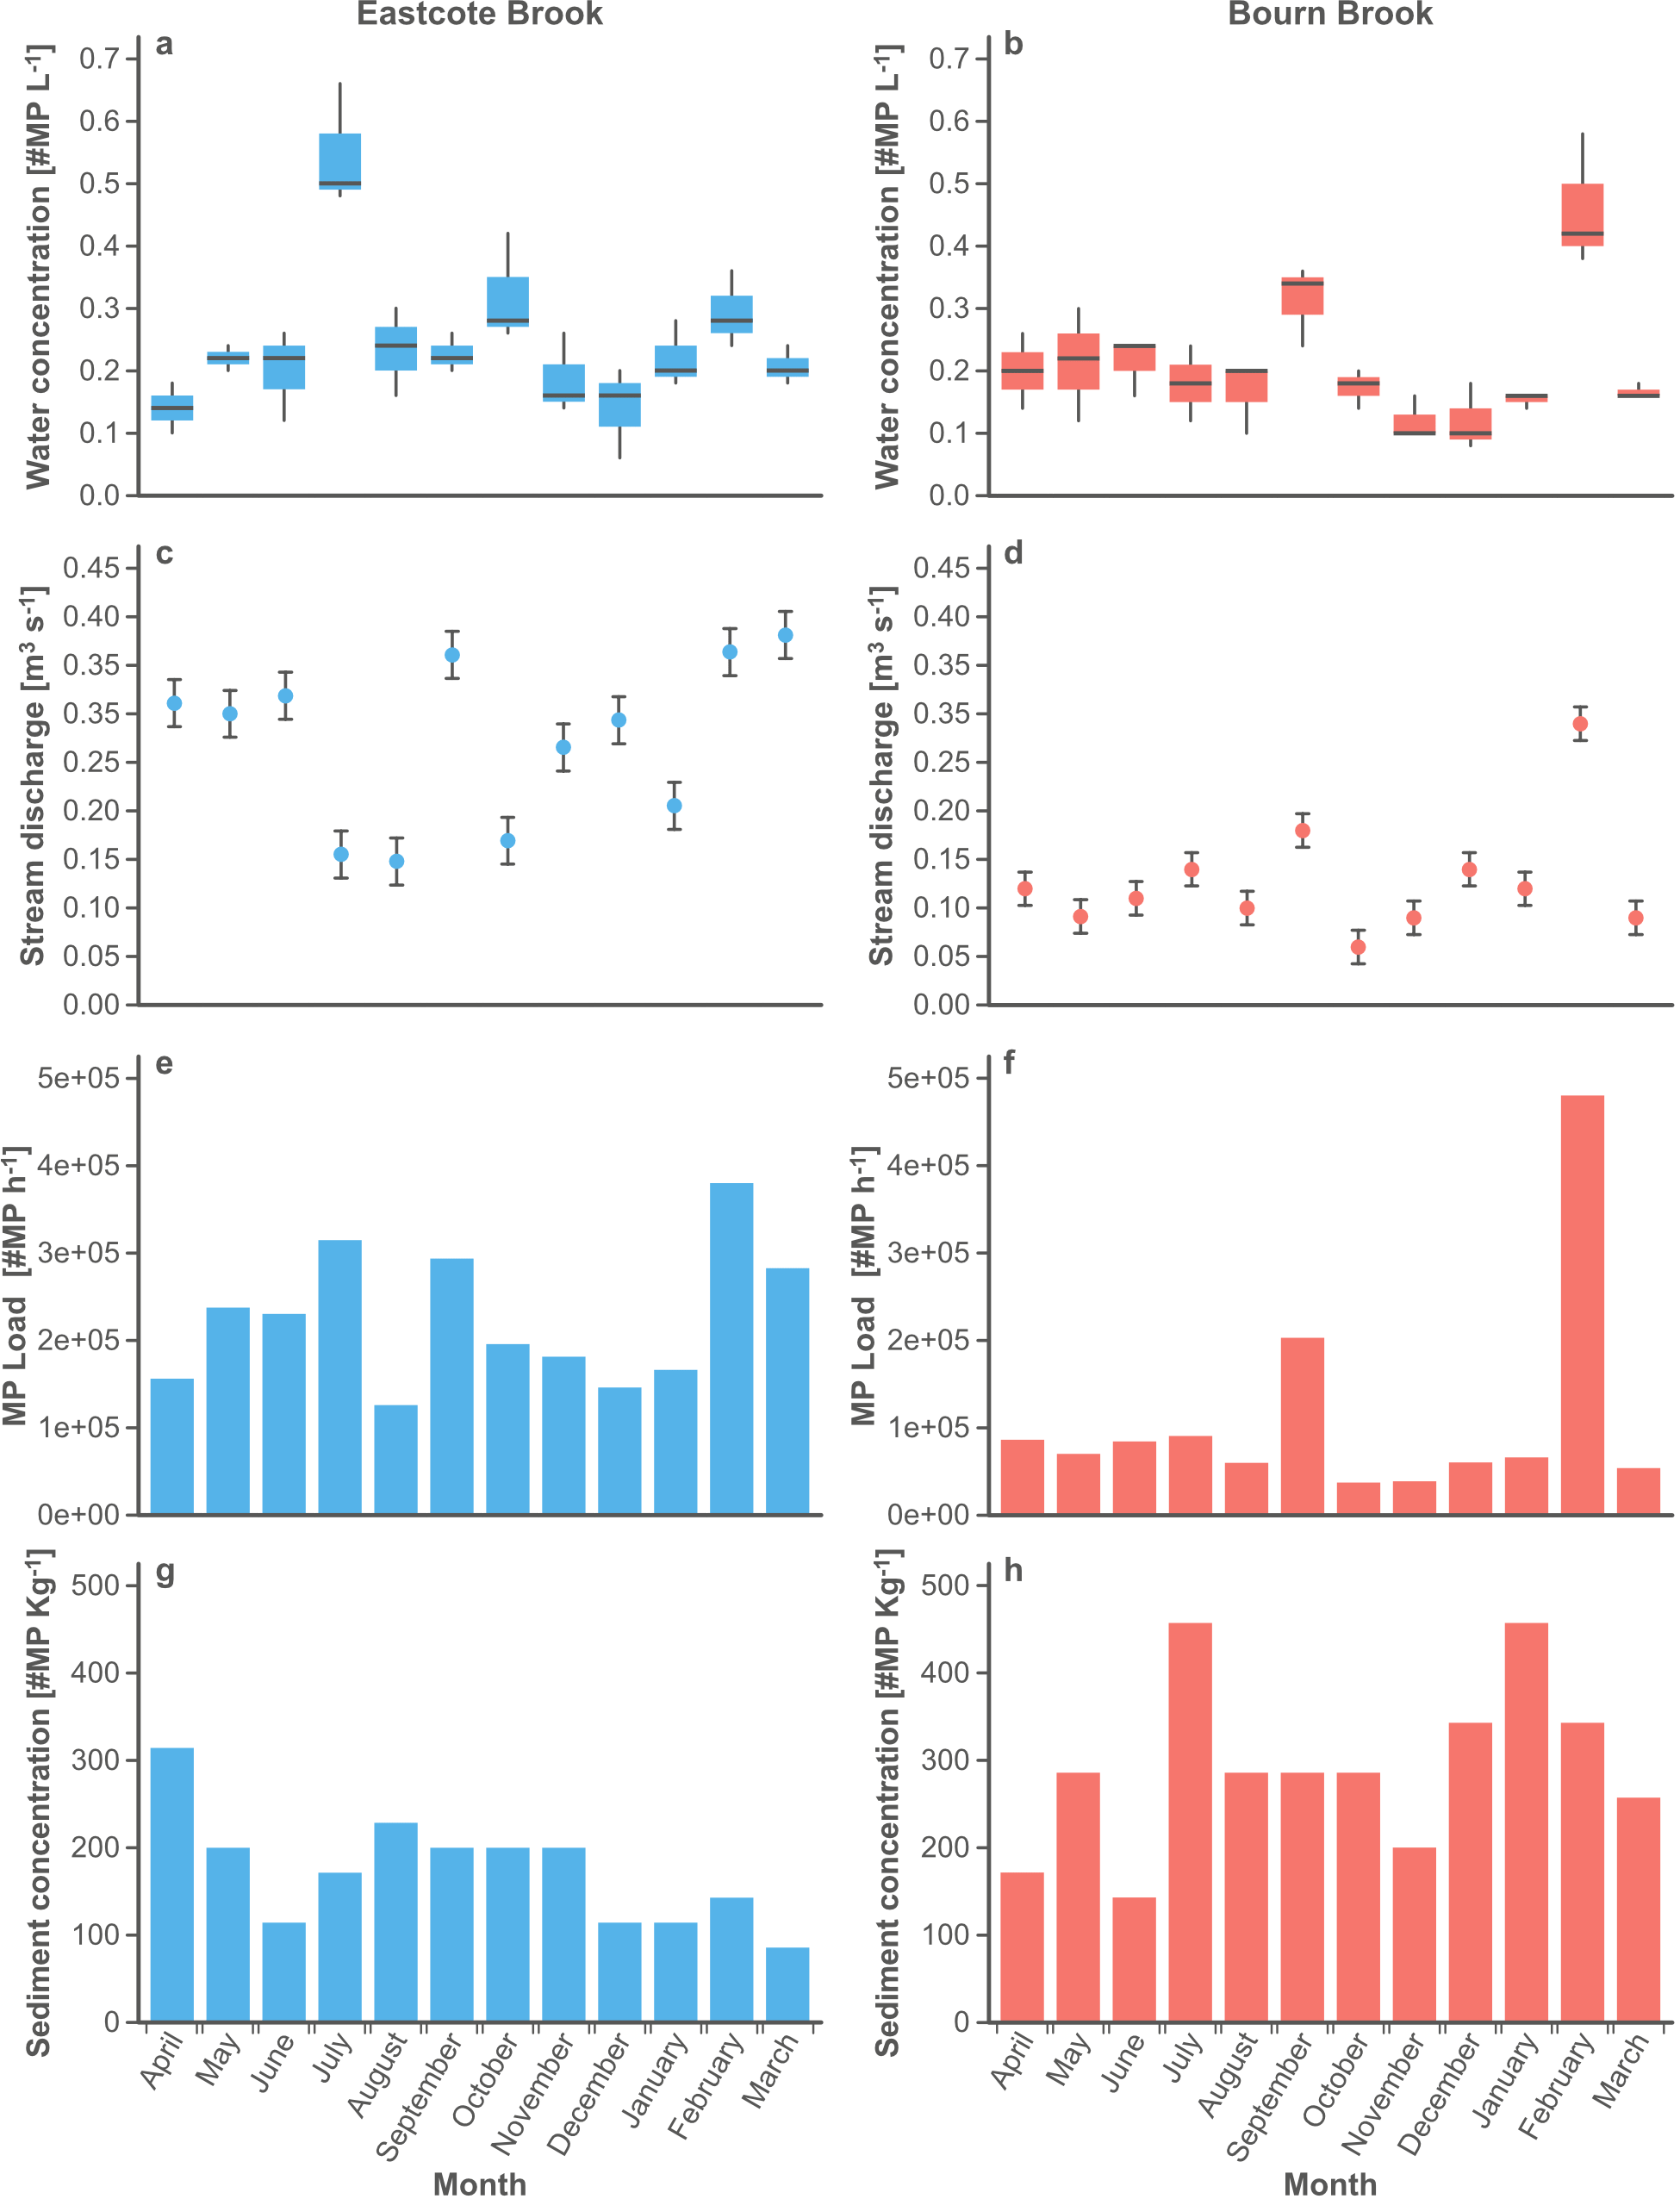
Simultaneous organic aerosol source apportionment at two Antarctic sites reveals large-scale and ecoregion-specific components. Published in Atmospheric Chemistry and Physics.Map for the paper, Retreating coastline, retreating government? Managing sea level rise in an age of austerity. Published in Ocean & Coastal Management.Map of mangrove root production measurements across the world. Published in Global Change Biology.Map created for the Persistence of the Victorian Prison project.Map of the BIFoR FACE forest in Mill Haft and its UK location. Published in Hydrological Processes.Map of climatic zones in Latin America and the Caribbean. Adapted from the Koppen-Geiger climate zones for this paper to add extra information and to make accessible for colour-blindness. Published in Energy Research and Social Science.Map showing the site locations and charts showing trends in nitrate and nitrogen oxidation ratio at London sites. Published in Climate and Atmospheric Science.Map of Jeddah city showing districts and the sporting walkways sampling sites. Comparison of PTE in dust of sporting walkways with those found in road dusts in urban, suburban and residential areas. Published in Atmospheric Pollution Research.Conceptual diagram indicating river water temperature (Tw) responses to meteorological and hydrological drought propagation. Published in Hydrological Processes.Microplastic load, diverted load and discharge graph and Experimental method chart. Published in Water Research.Graph for news article, ‘Early COVID-19 lockdowns had less impact on urban air quality than first believed‘ – for Zongbo Shi.Graphics with graphs showing salinity affecting aerosol production.Example of a multi-panel graph.Rich image showing how a river changes course over time.