Streamline your figure design process and focus on what you do best – your research.
With a First Class degree in Visual Communication and multiple figures published in top-tier journals, I understand exactly what academic publishers require.
Through a collaborative process, I transform your concepts, sketches, or rough ideas into polished visuals that balance scientific accuracy with visual impact.
Every illustration is optimised for your target journal’s specifications, ensuring smooth submission and peer review success.
See how I can bring your research to life.
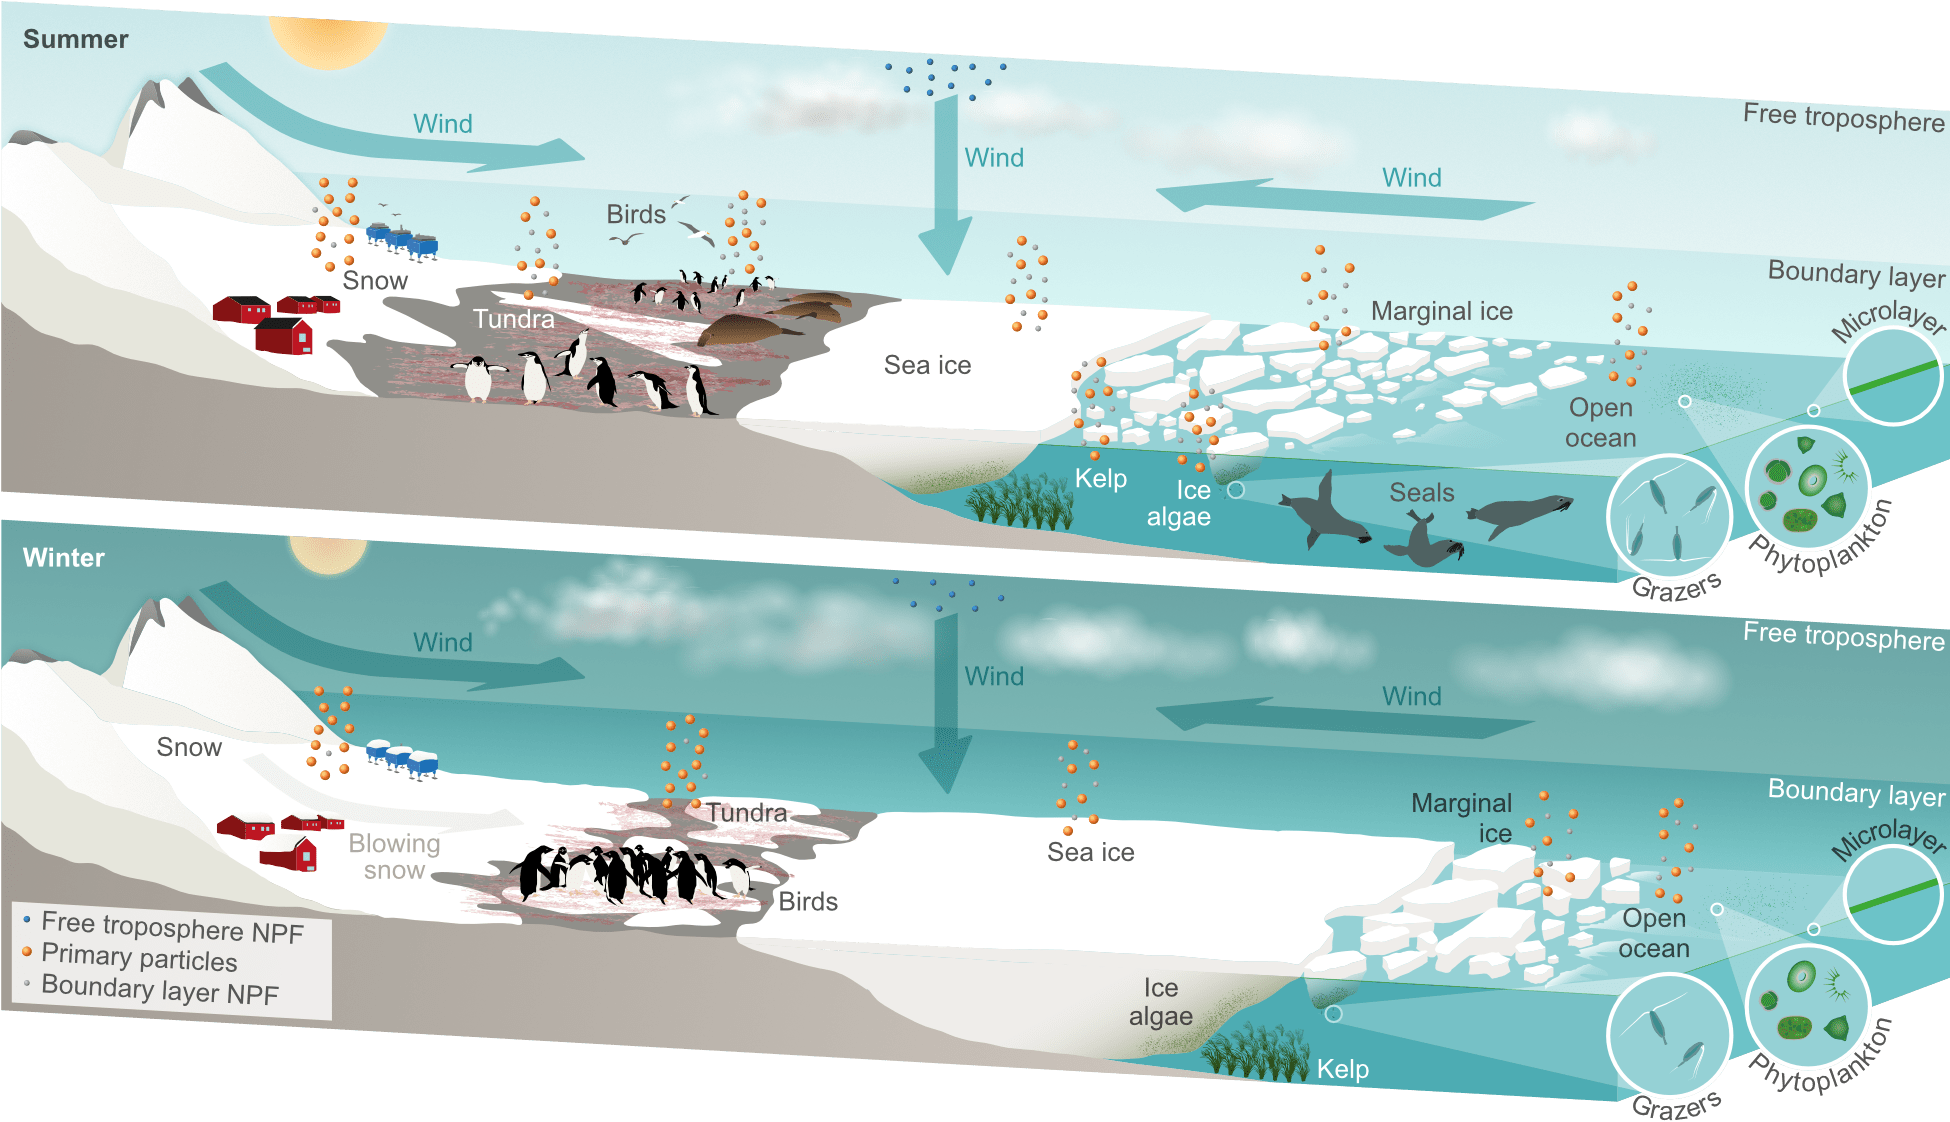
Schematic illustrations of the sea ice, microbiota, sea-to-air emissions, and primary and secondary aerosols in Antarctica during summer and winter. Published in Atmospheric Chemistry and Physics.
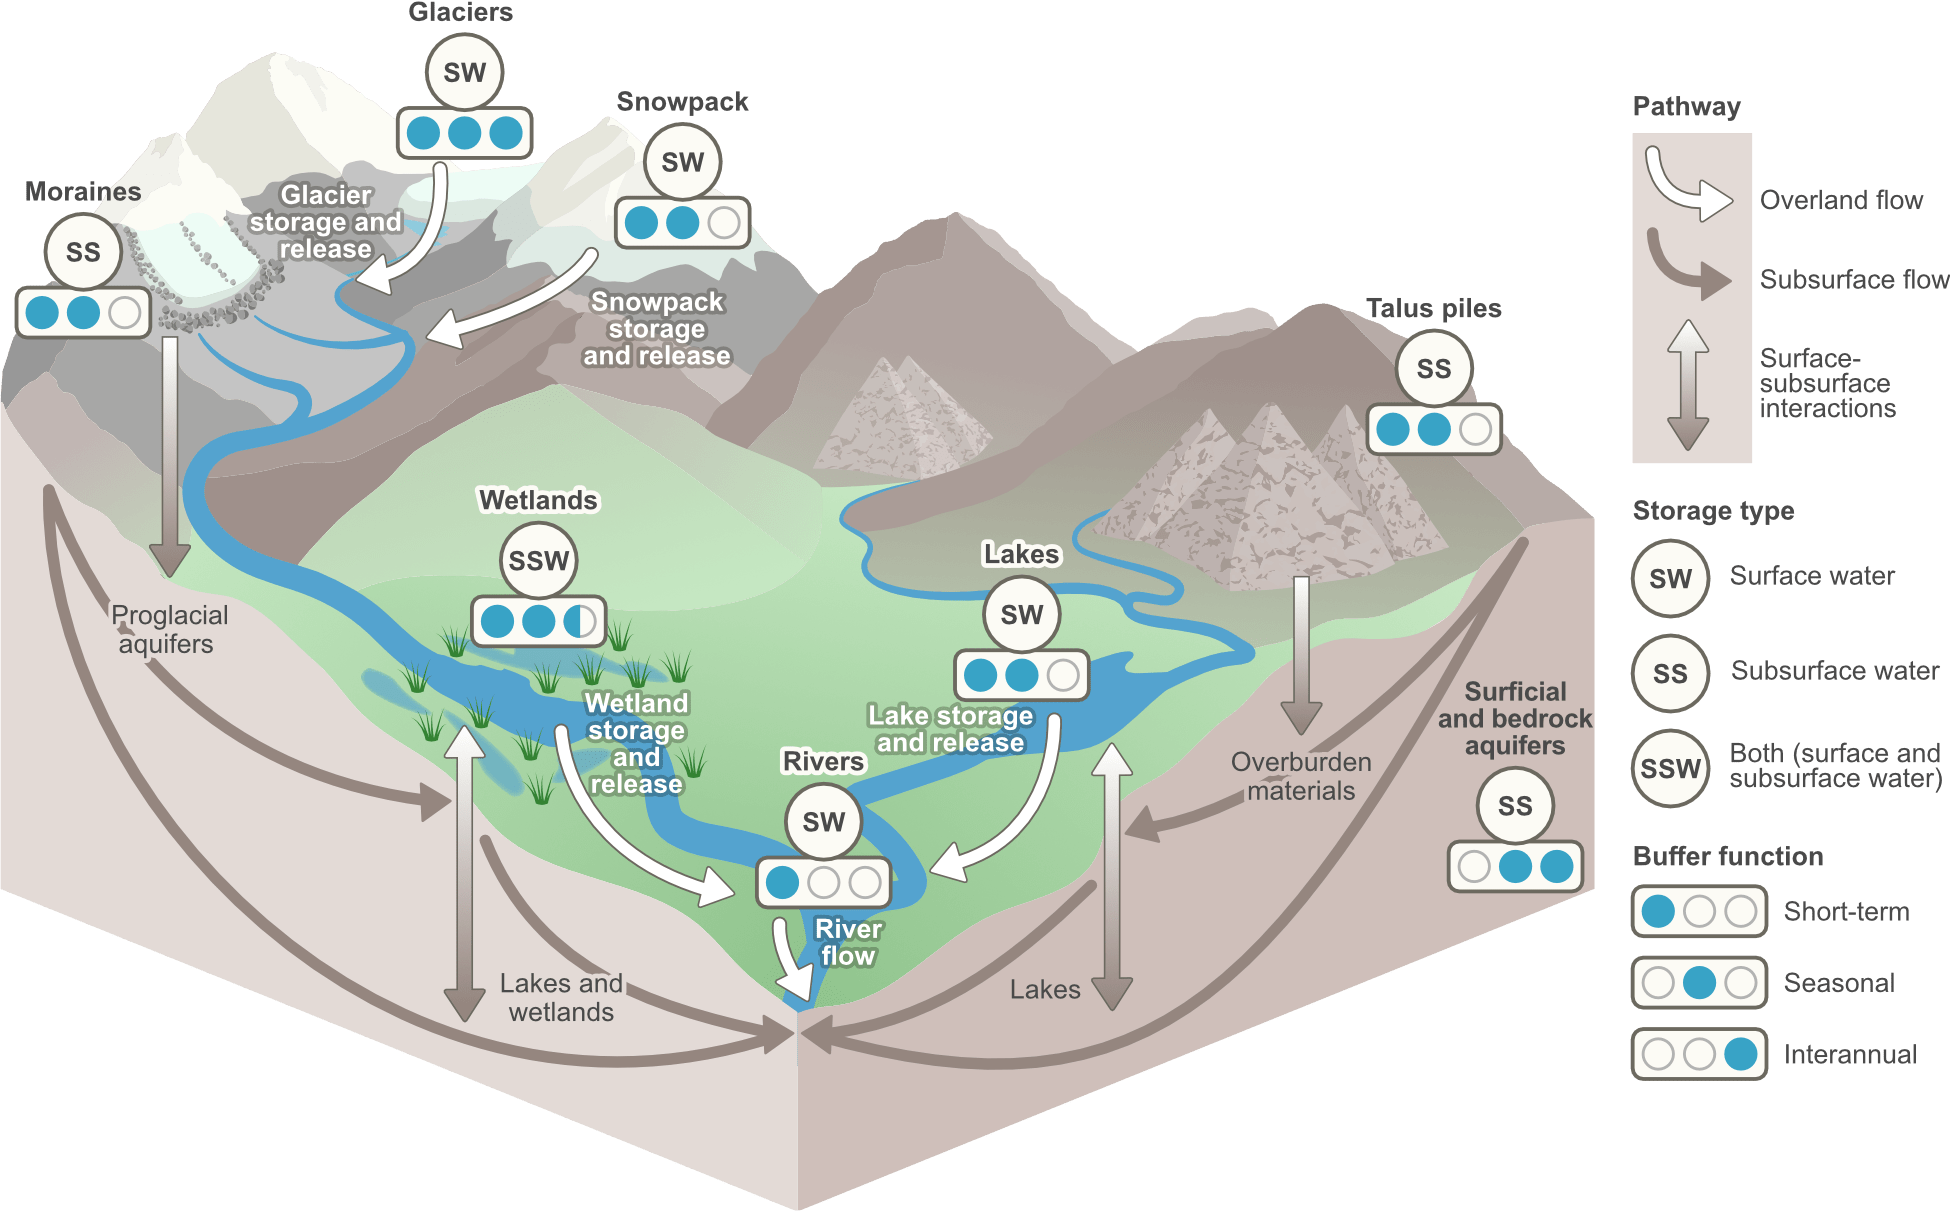
Components and interactions of the hydrological cycle within a catchment context. Published in Nature Sustainability.
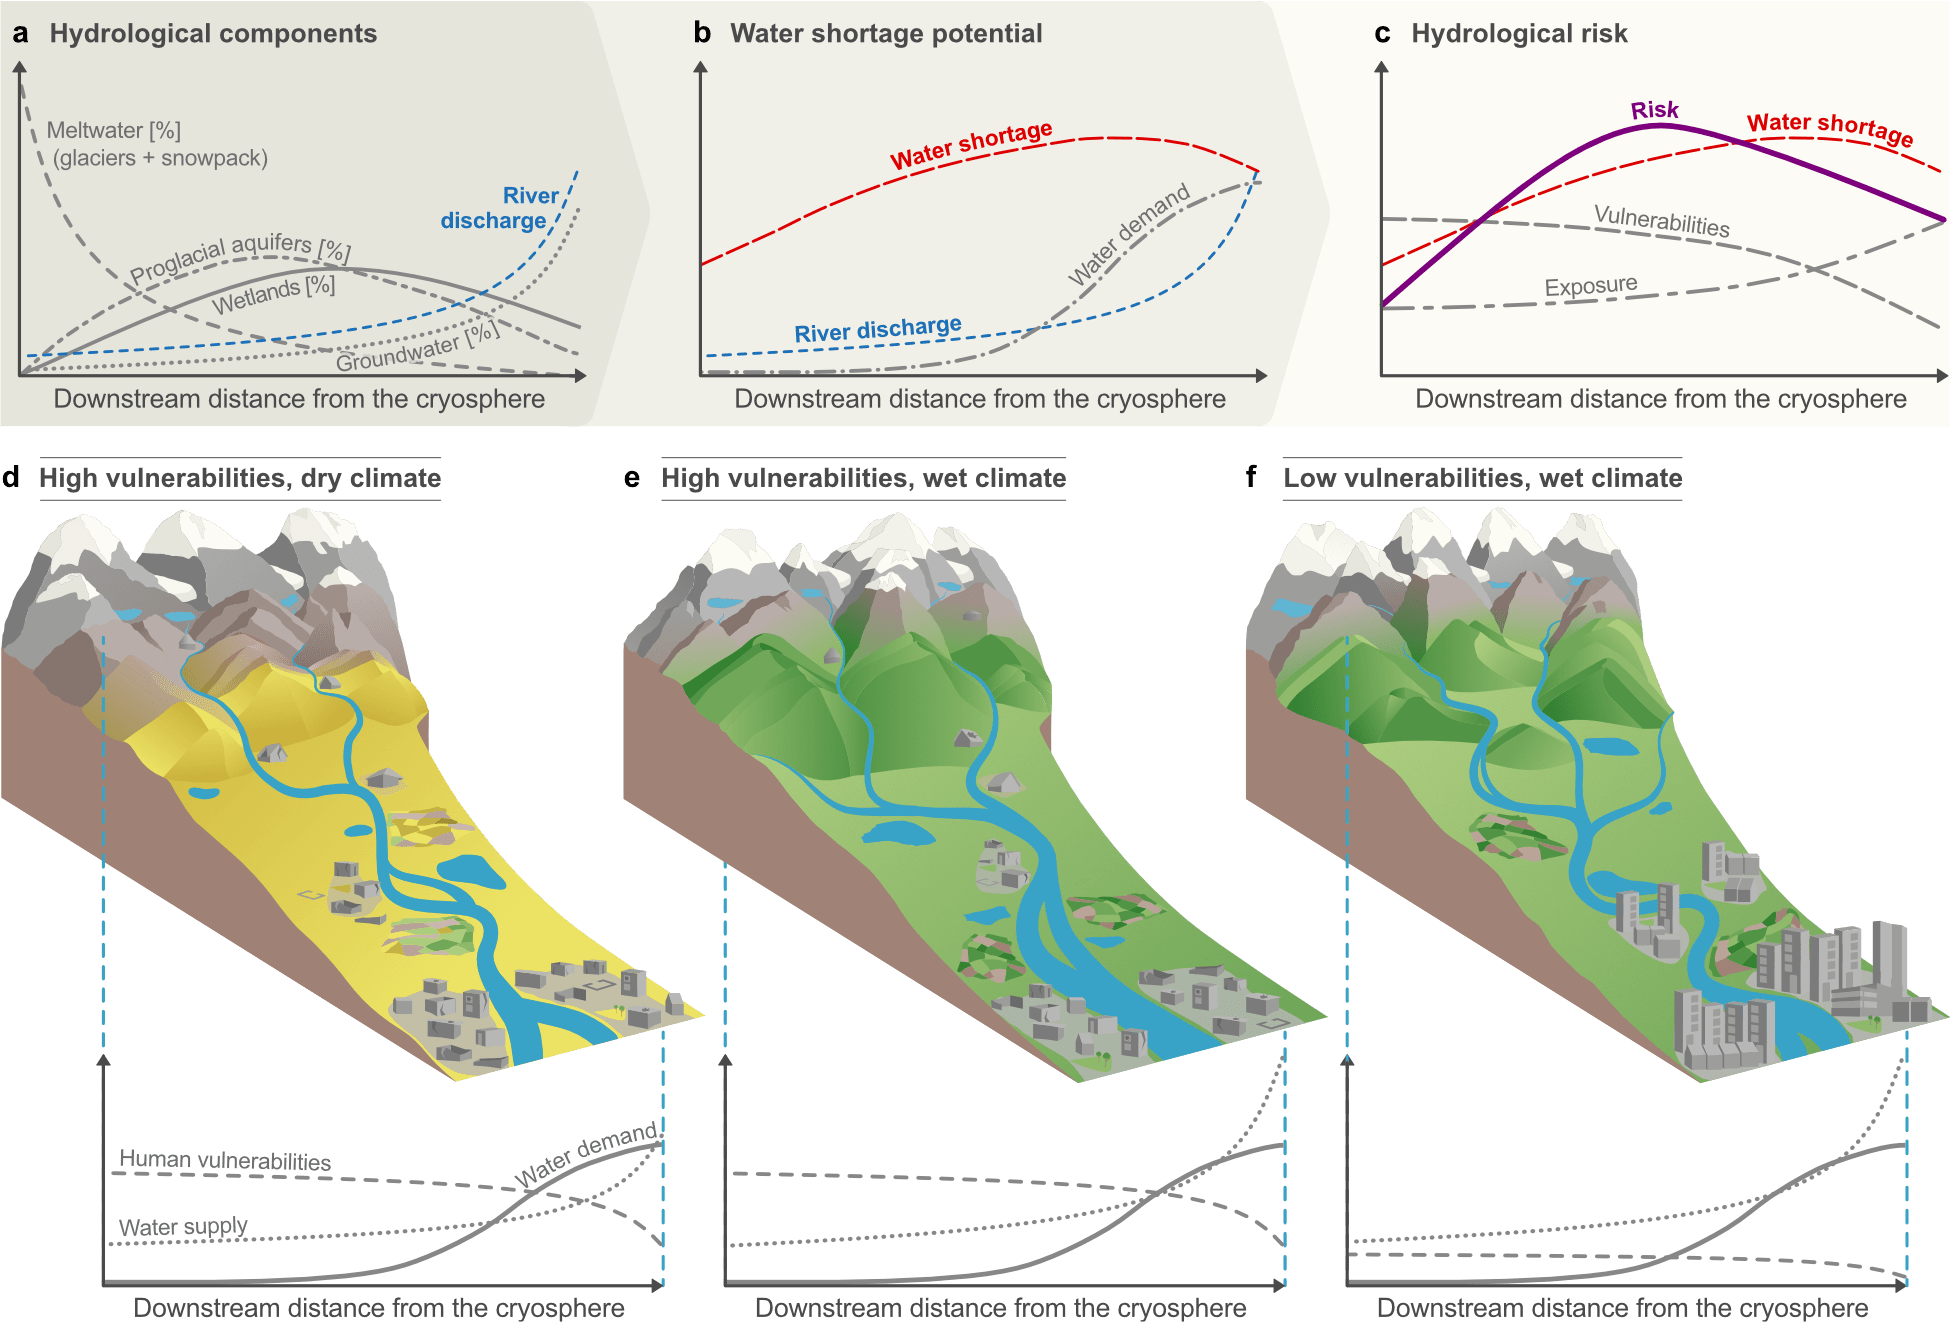
Conceptual representation of the upstream–downstream gradient of risks and its contributing factors in a glacierized basin. Published in Nature Sustainability.
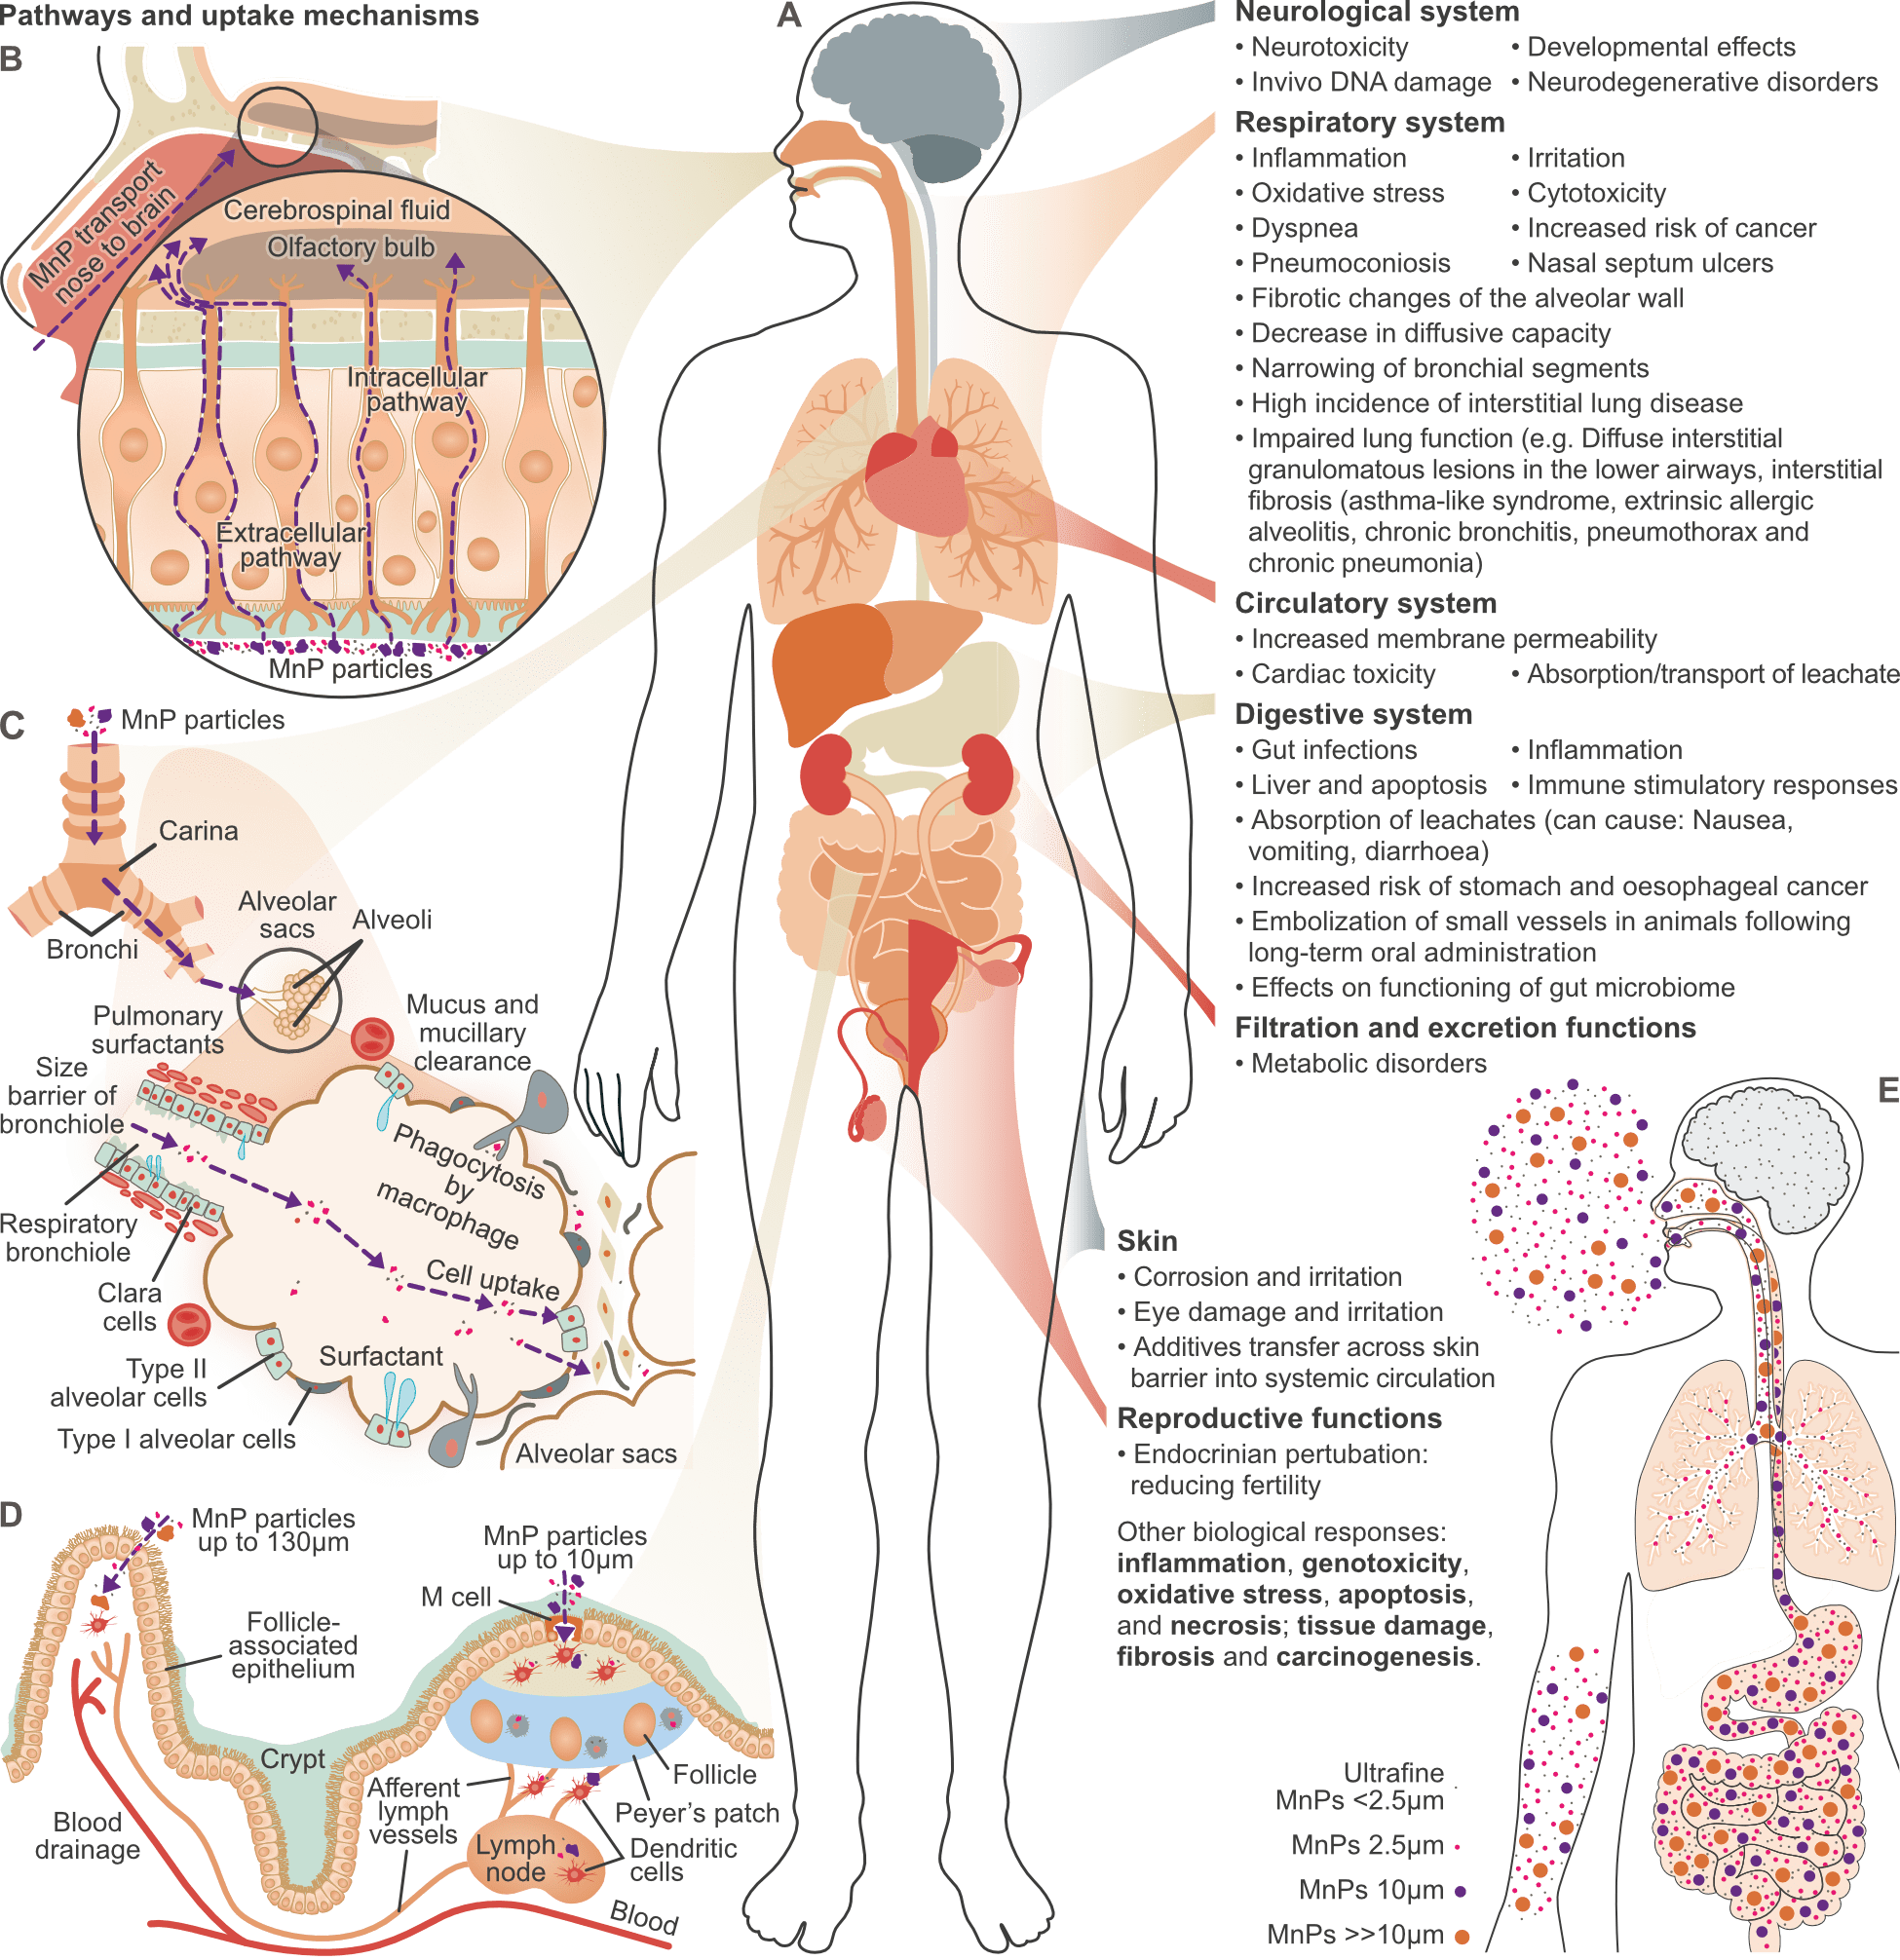
Hypothesized uptake mechanisms of MnPs through human body. Published in Cell Reports Medicine.
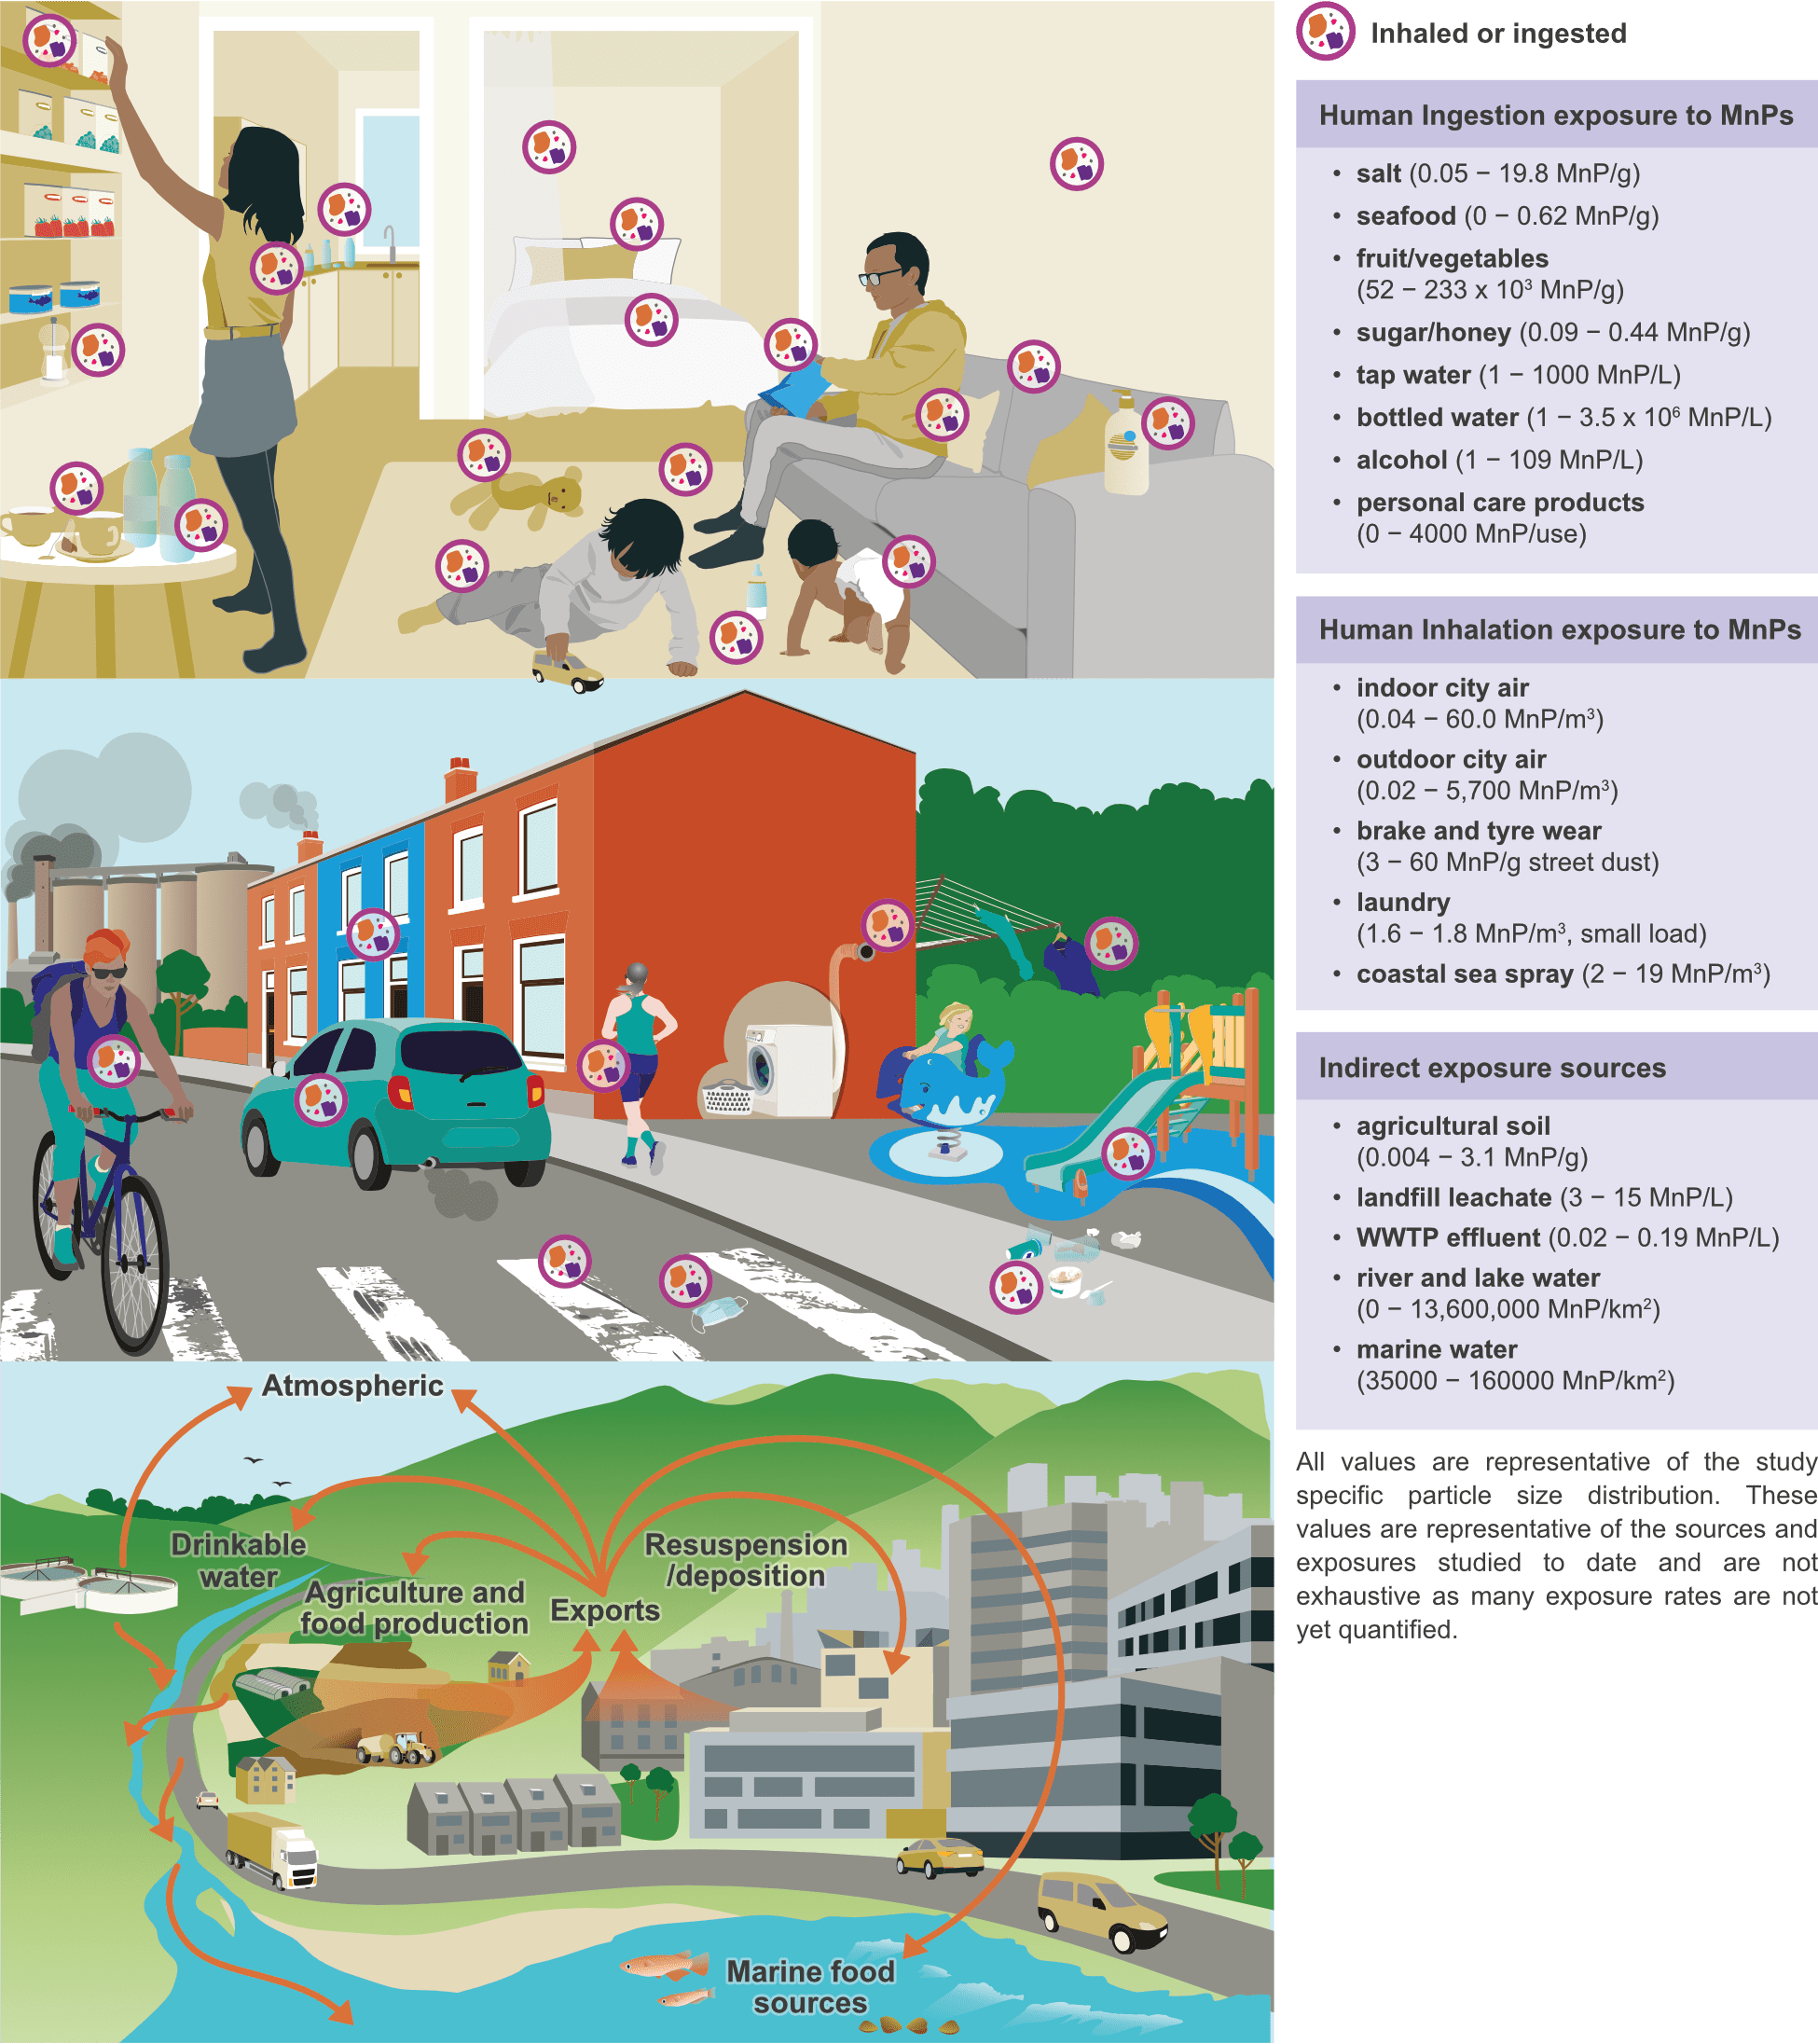
Environmental exposure routes, transport, and sources of MnPs. Published in Cell Reports Medicine.
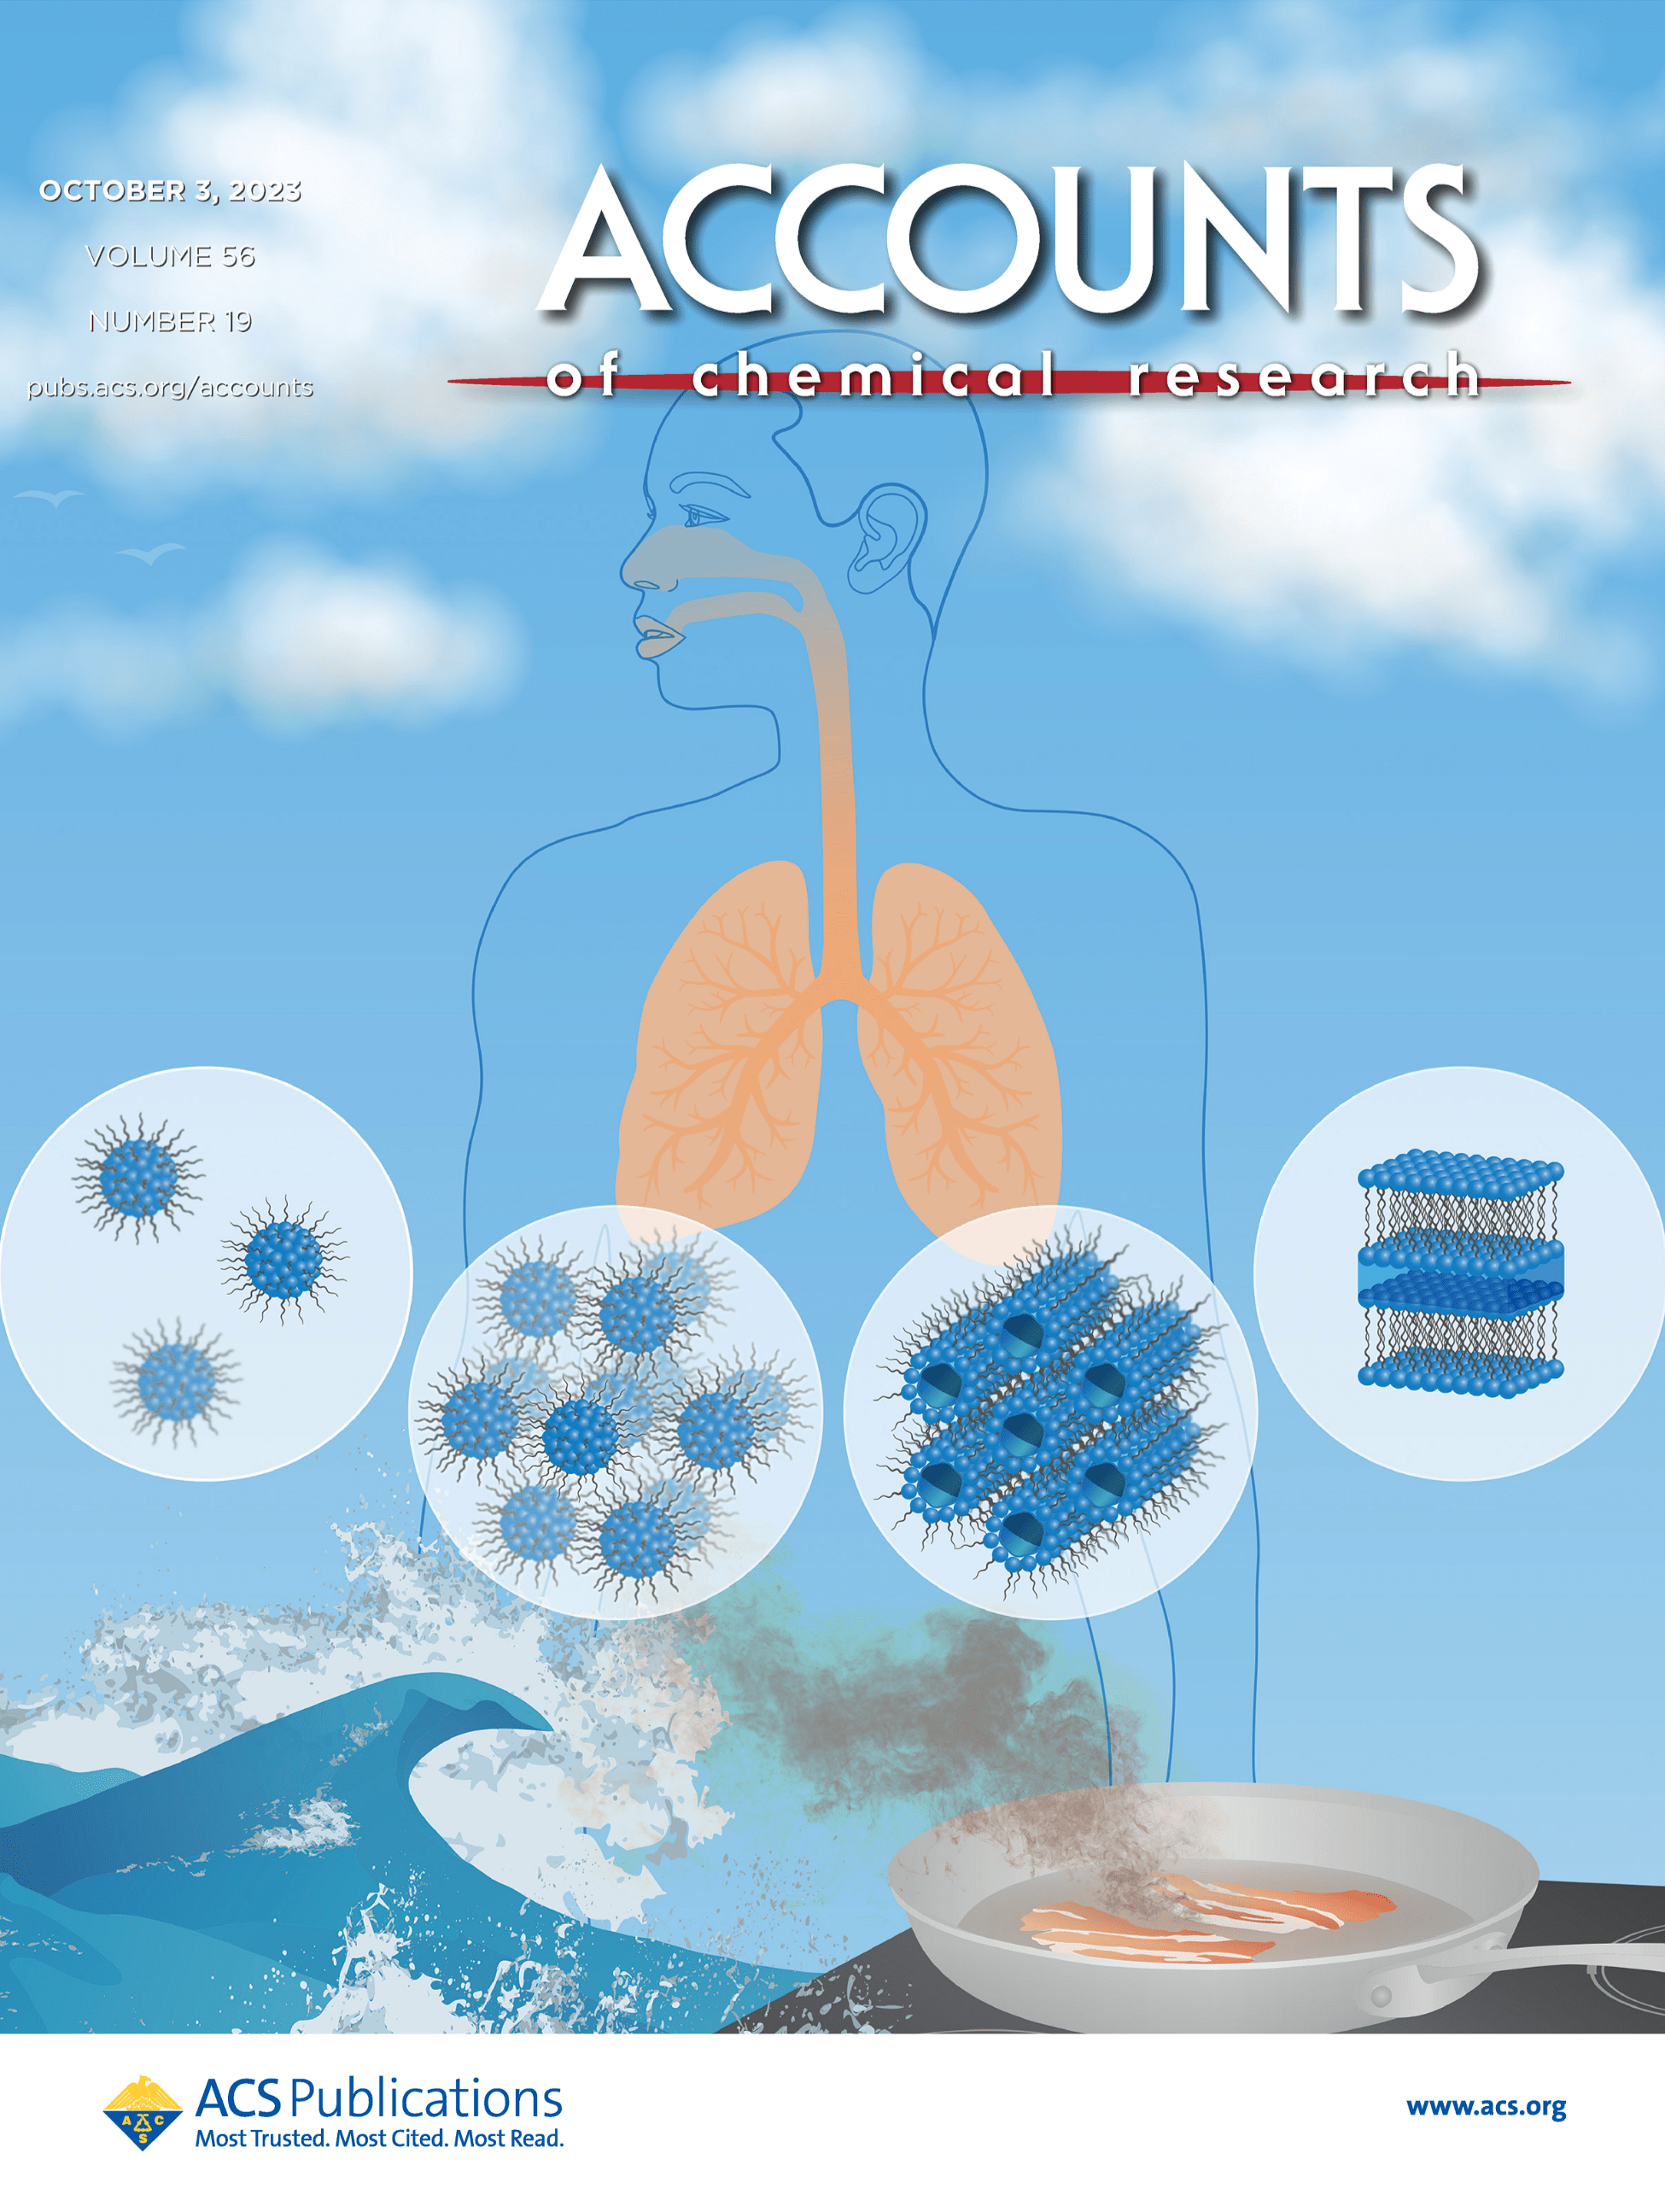
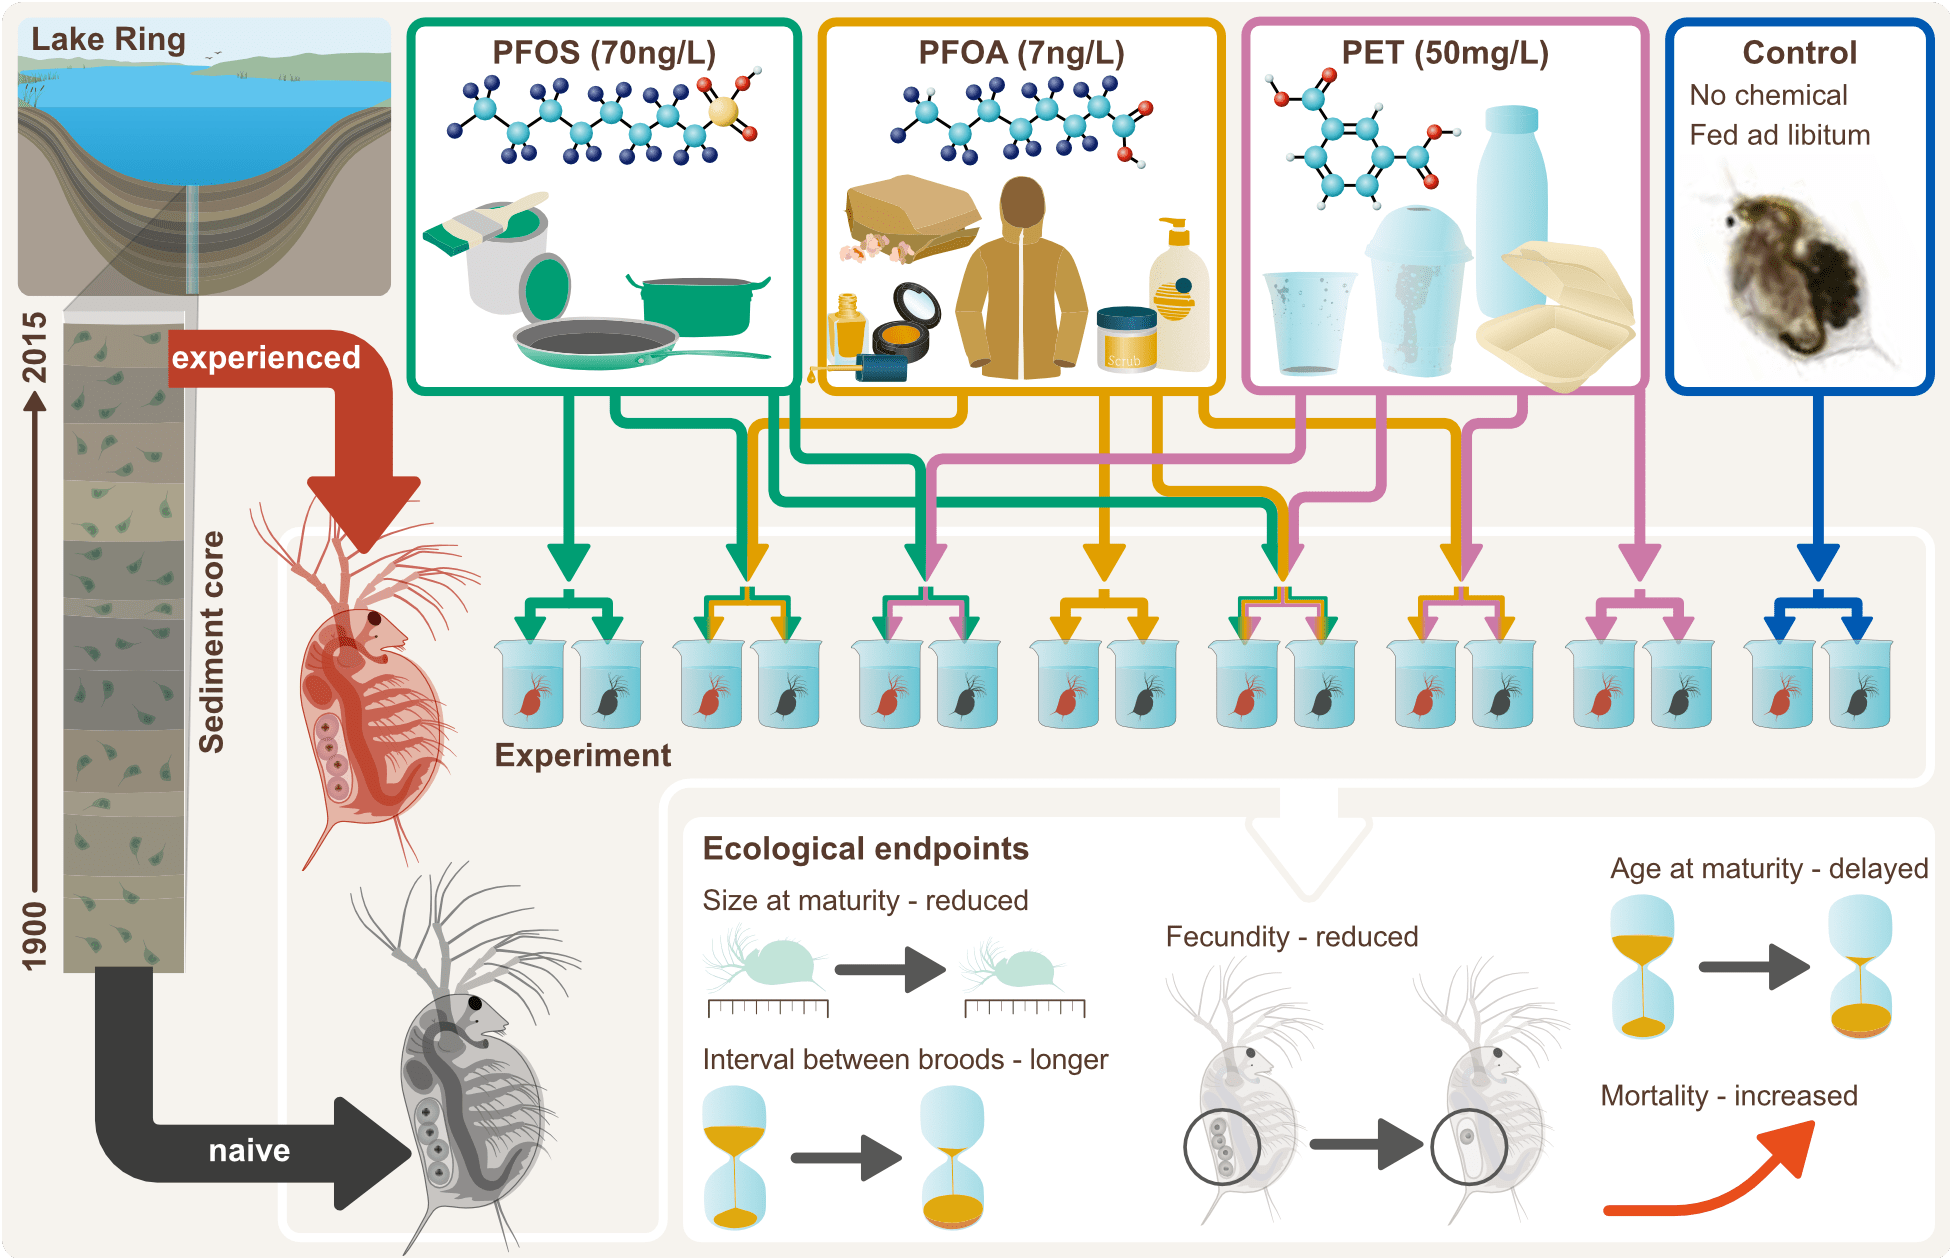
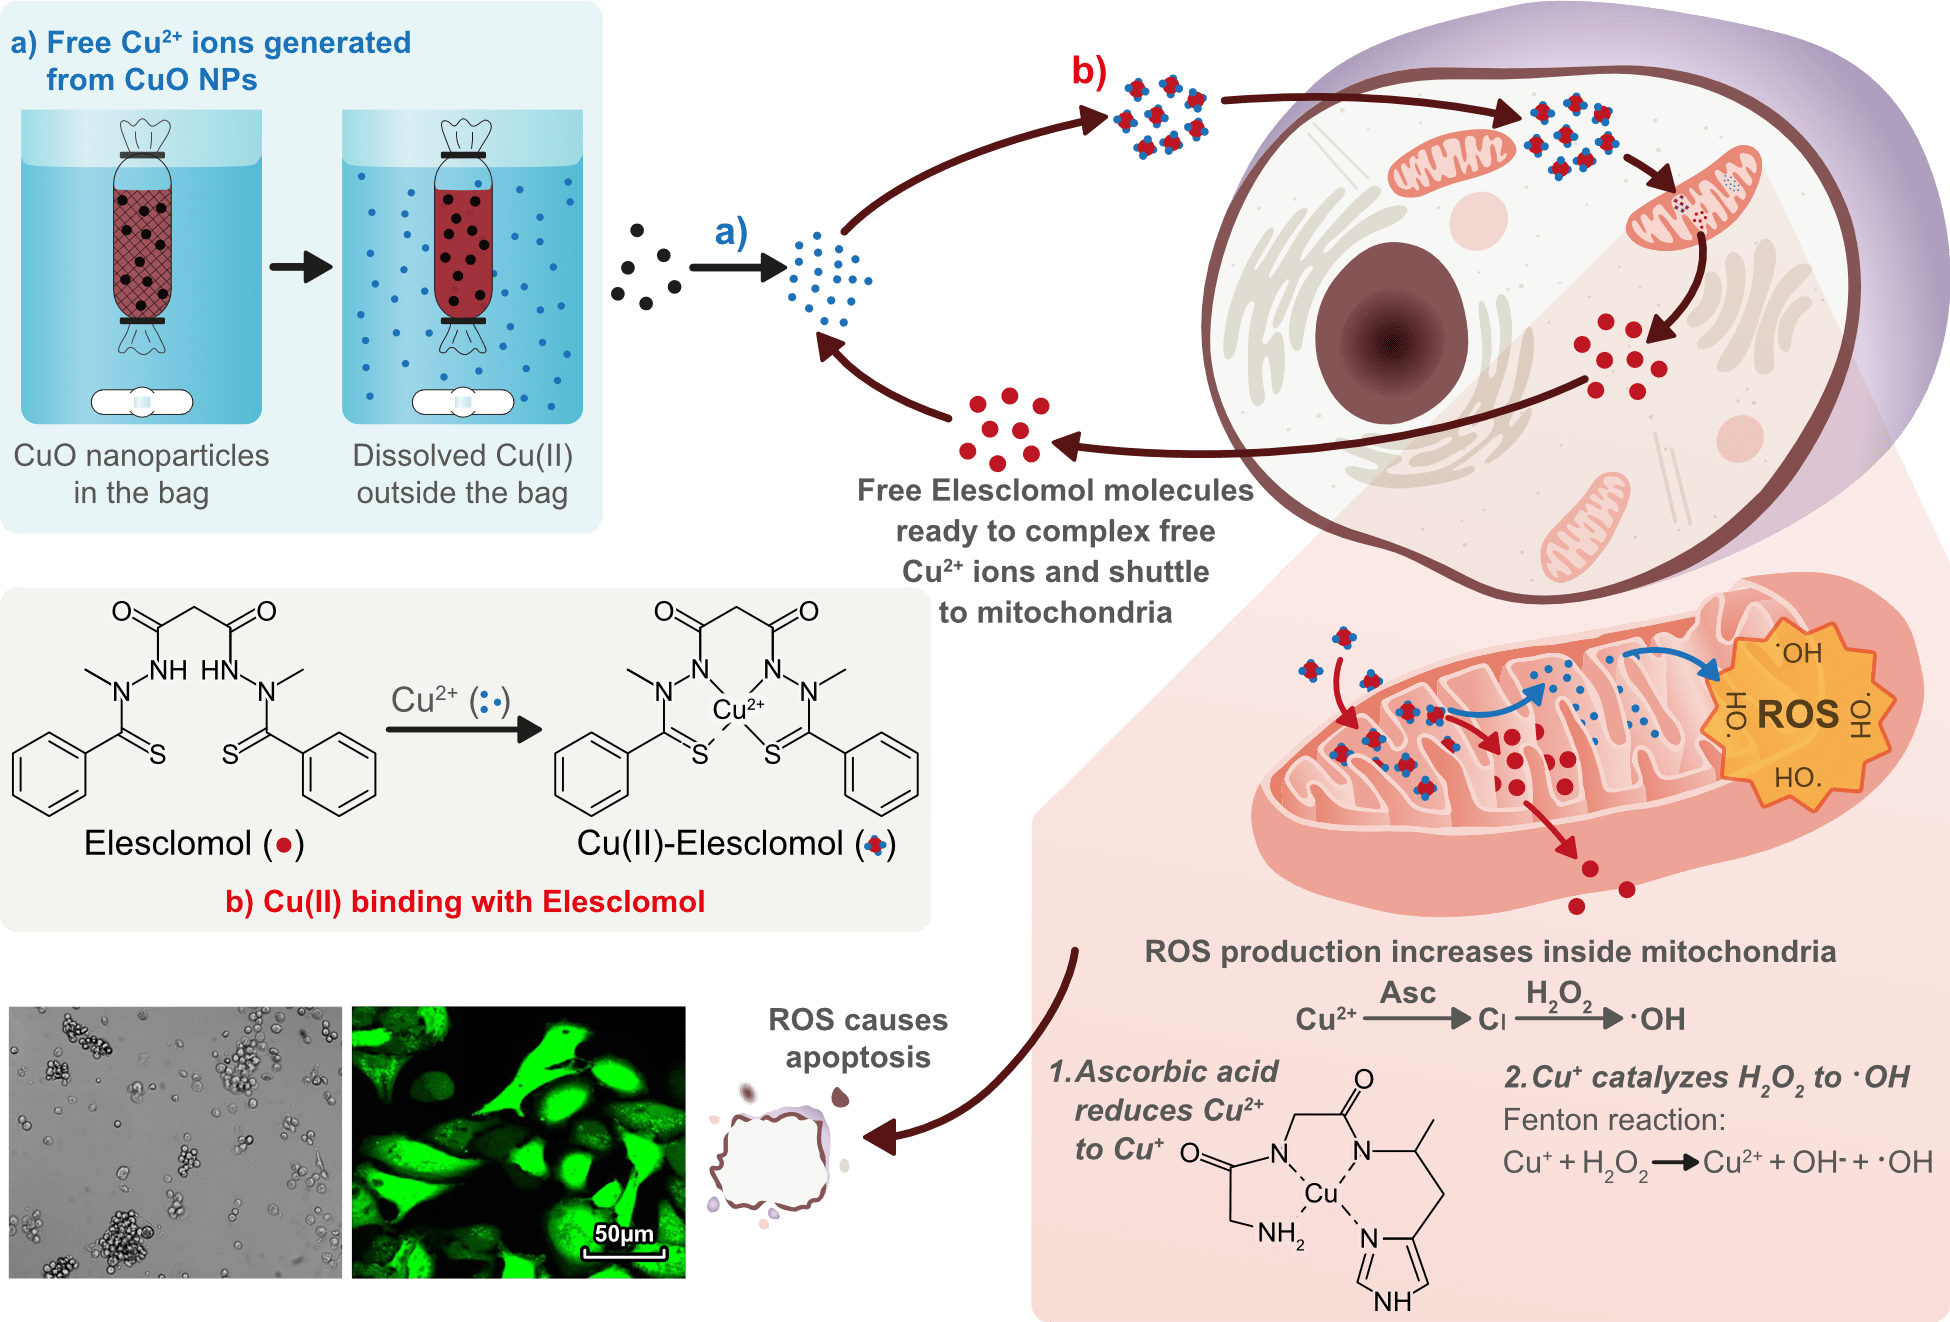
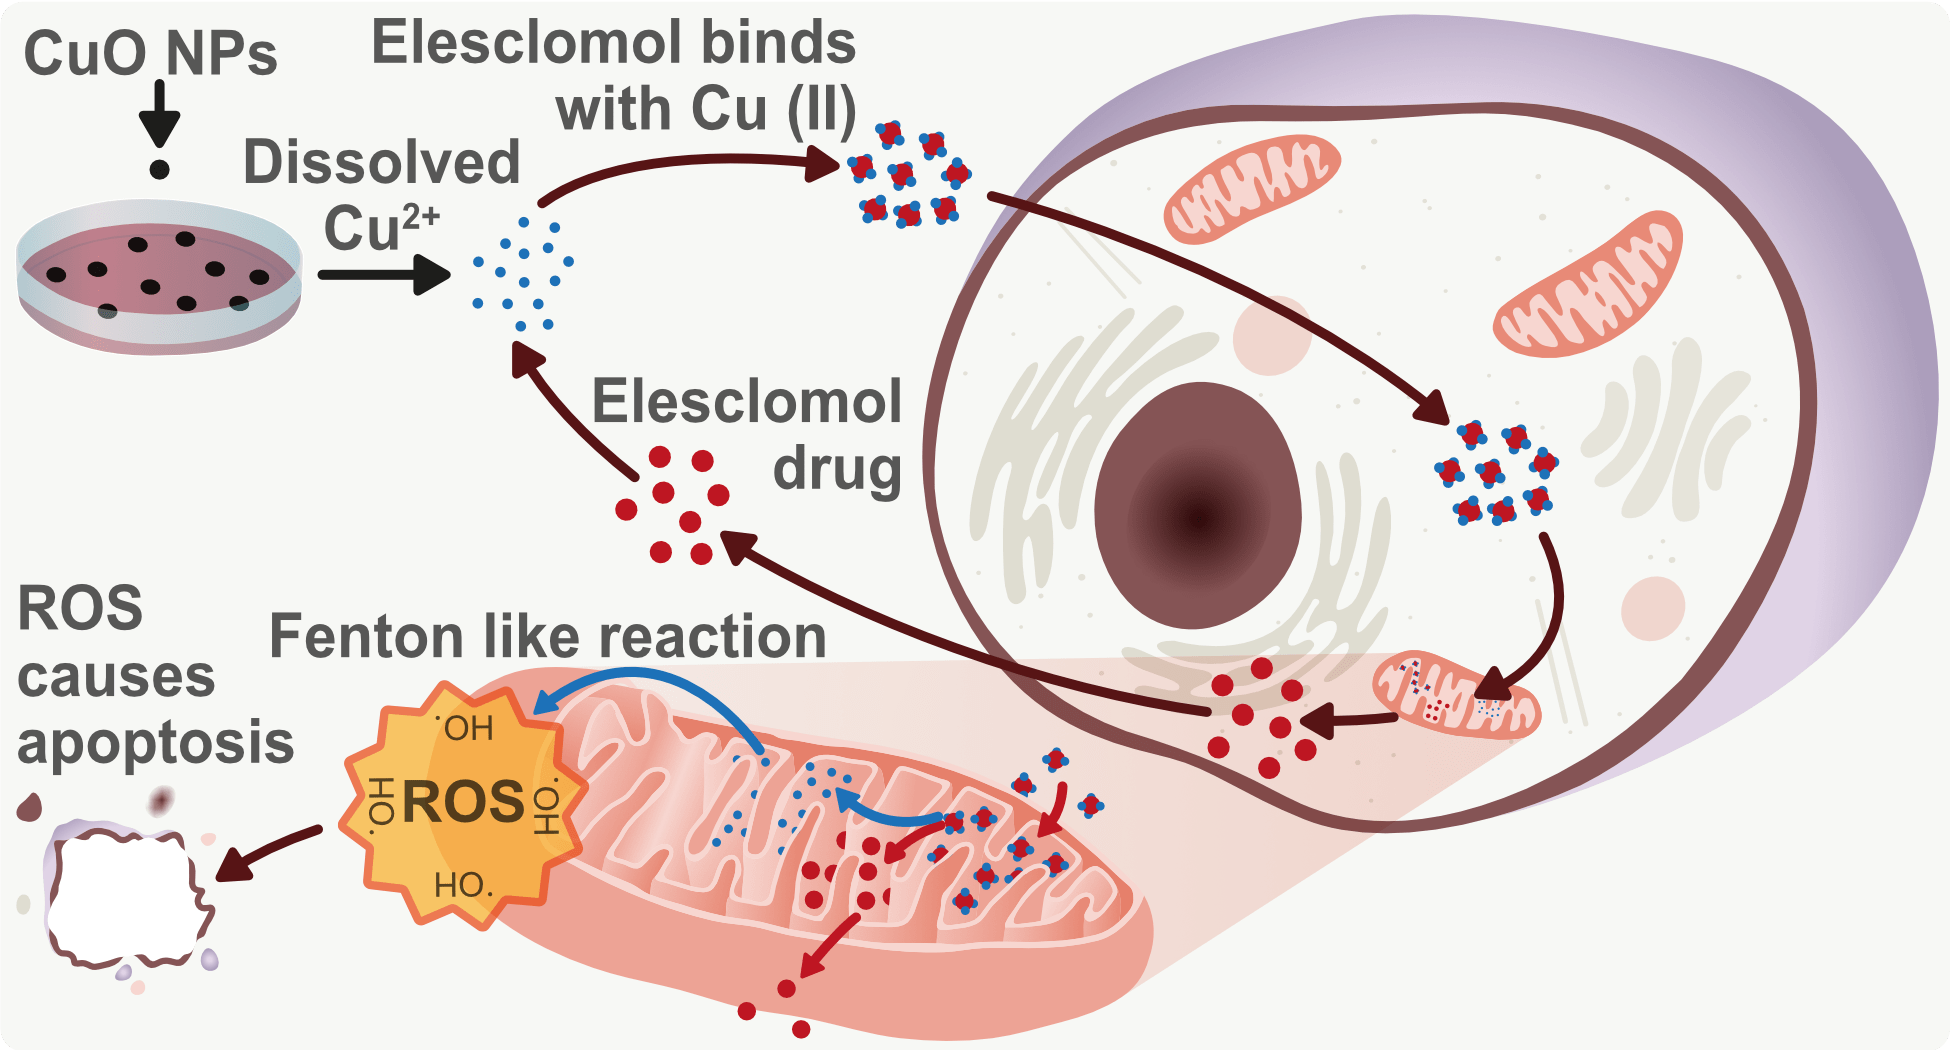
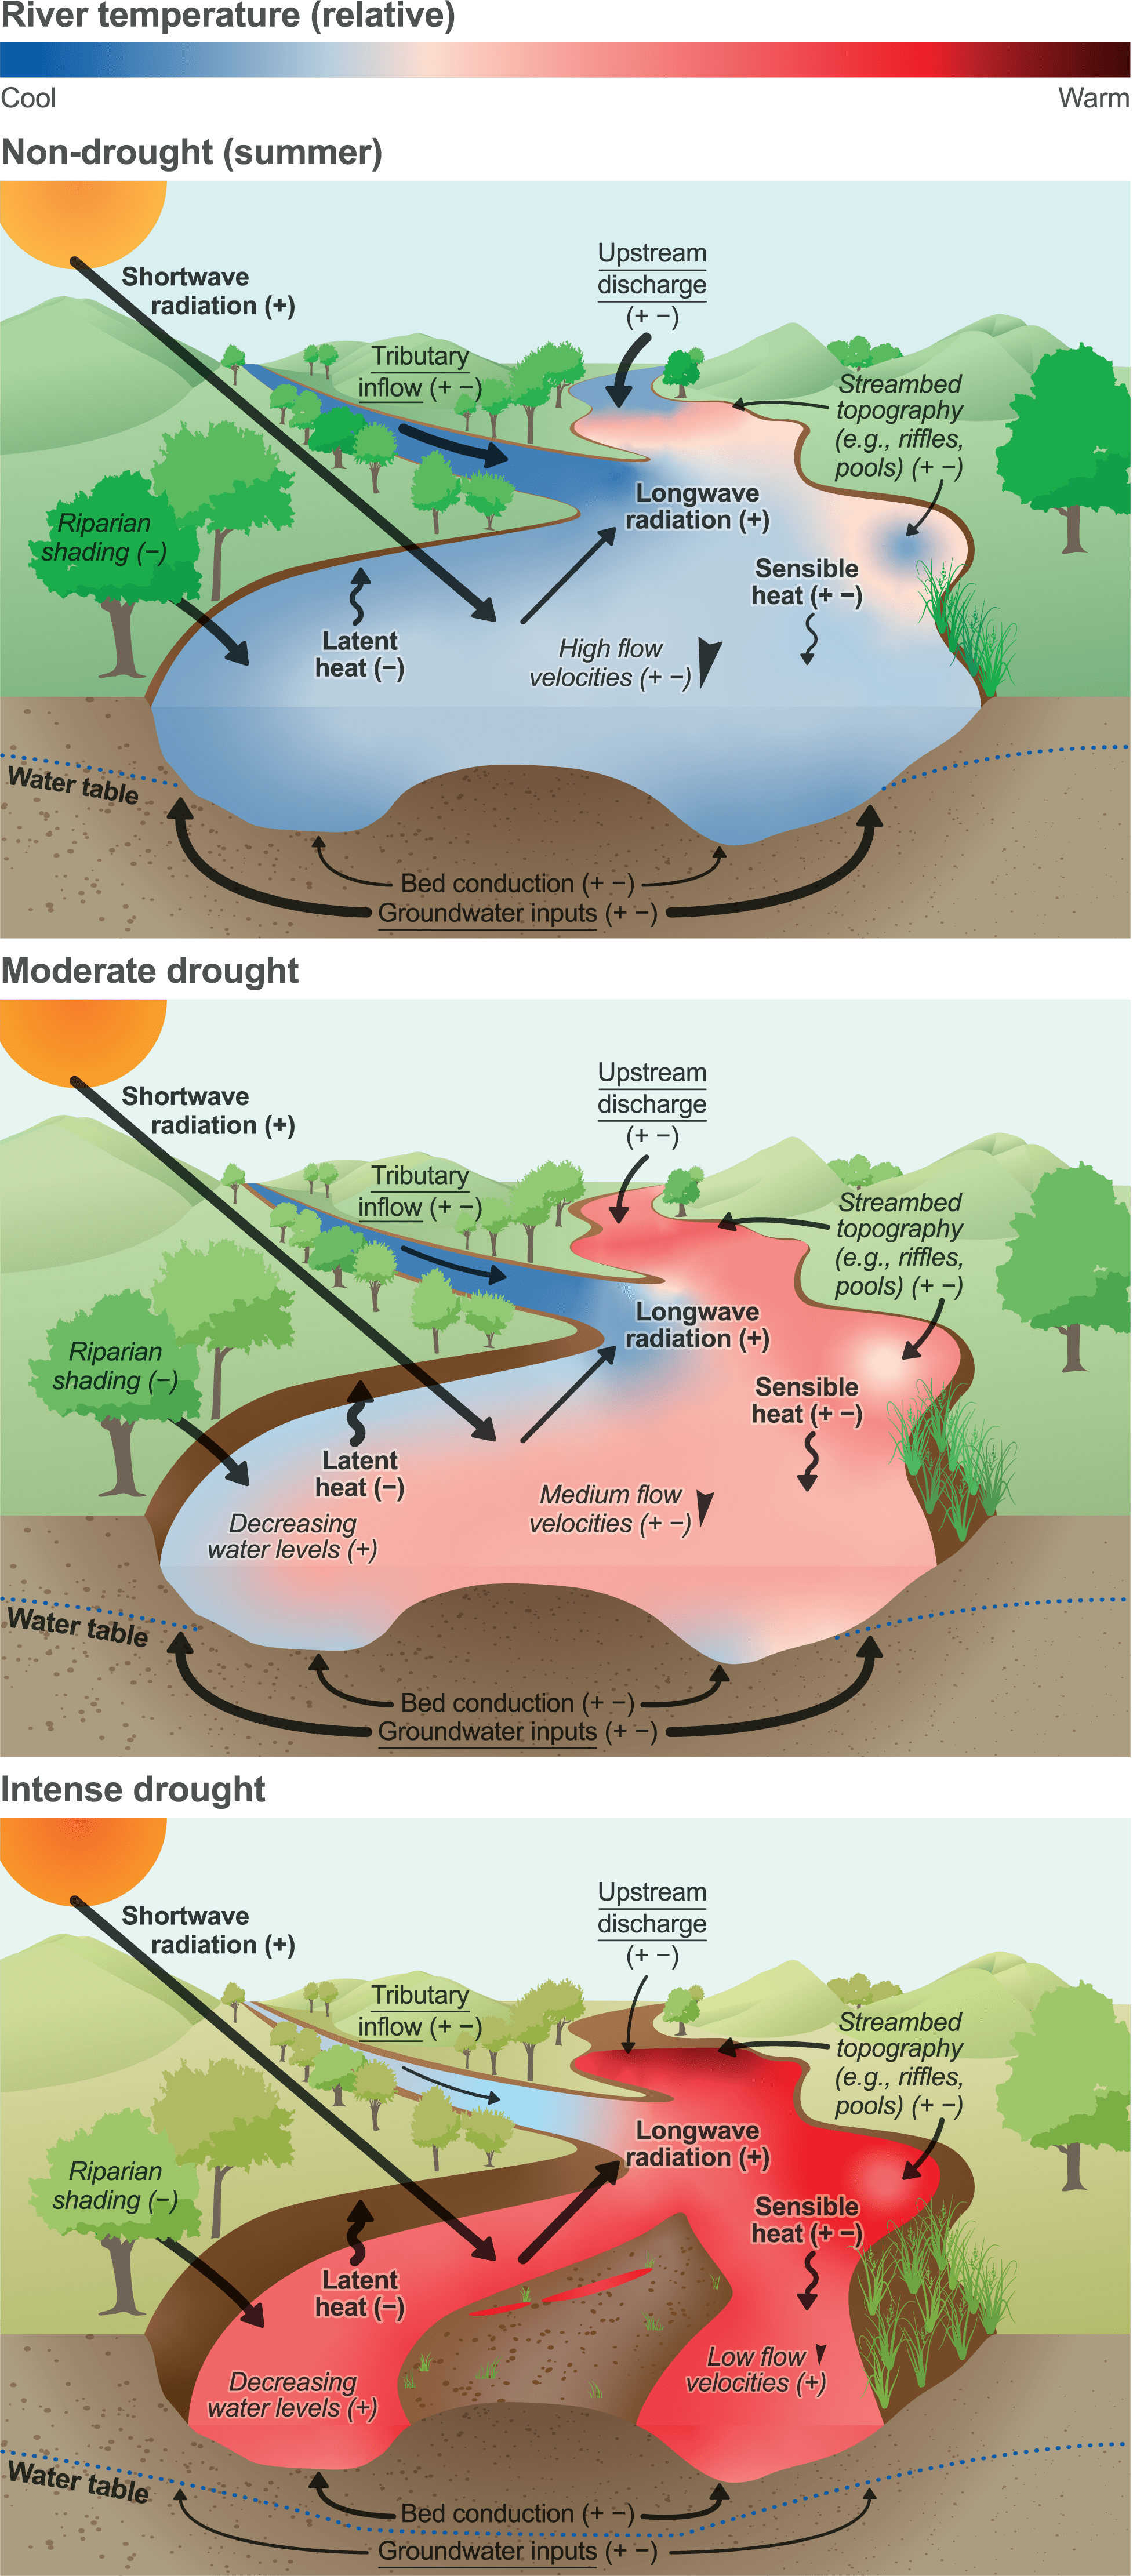
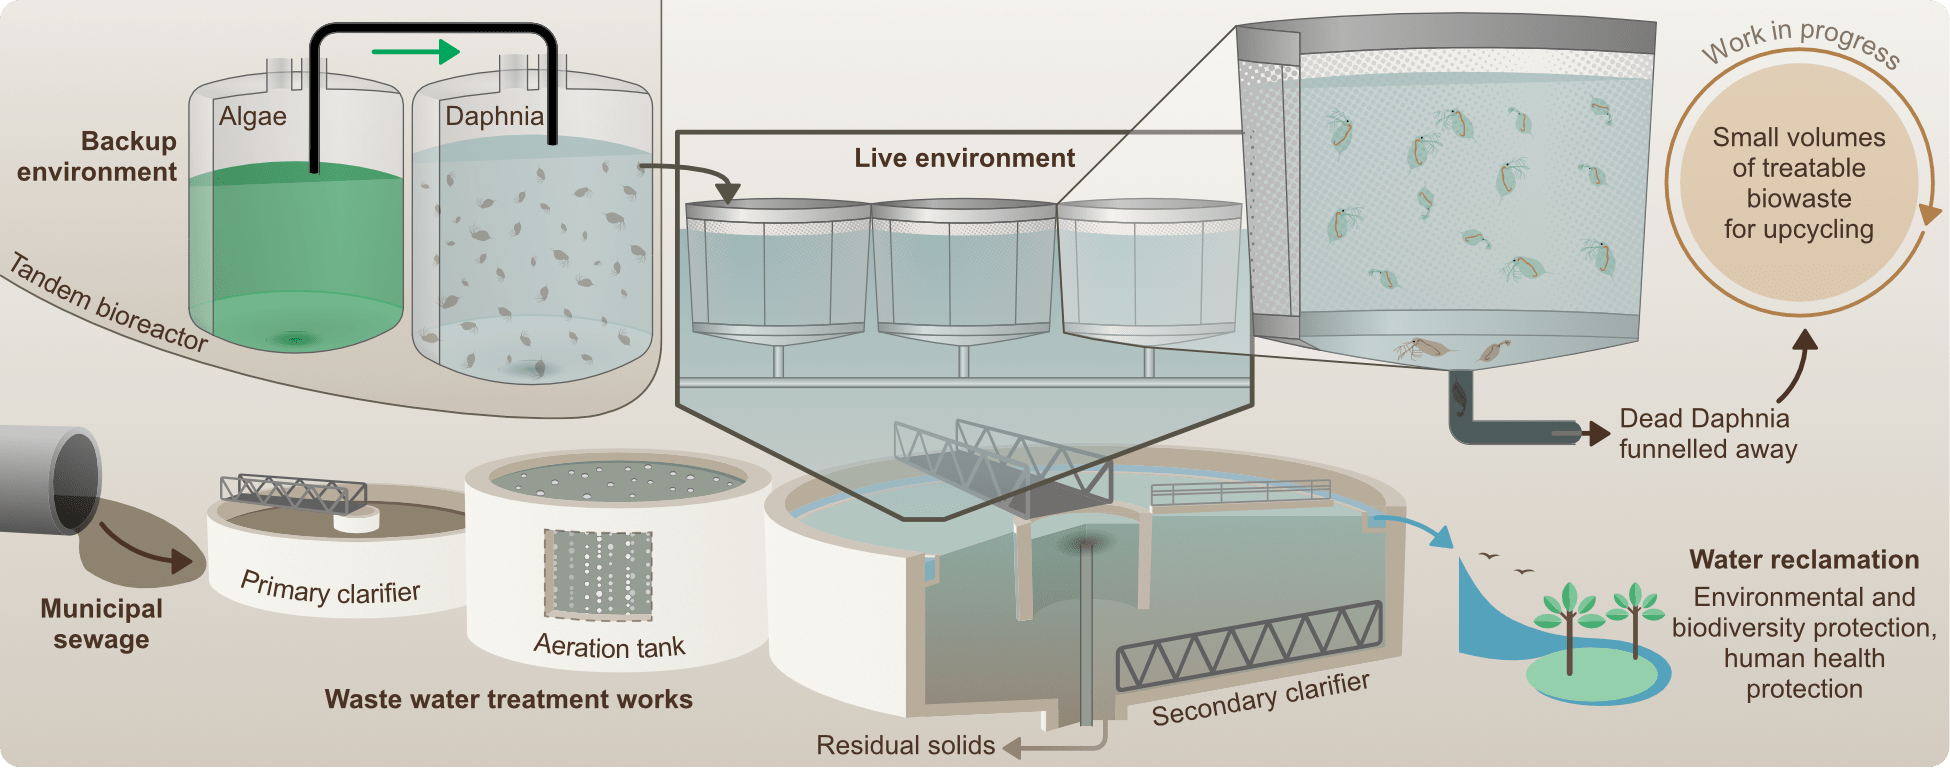
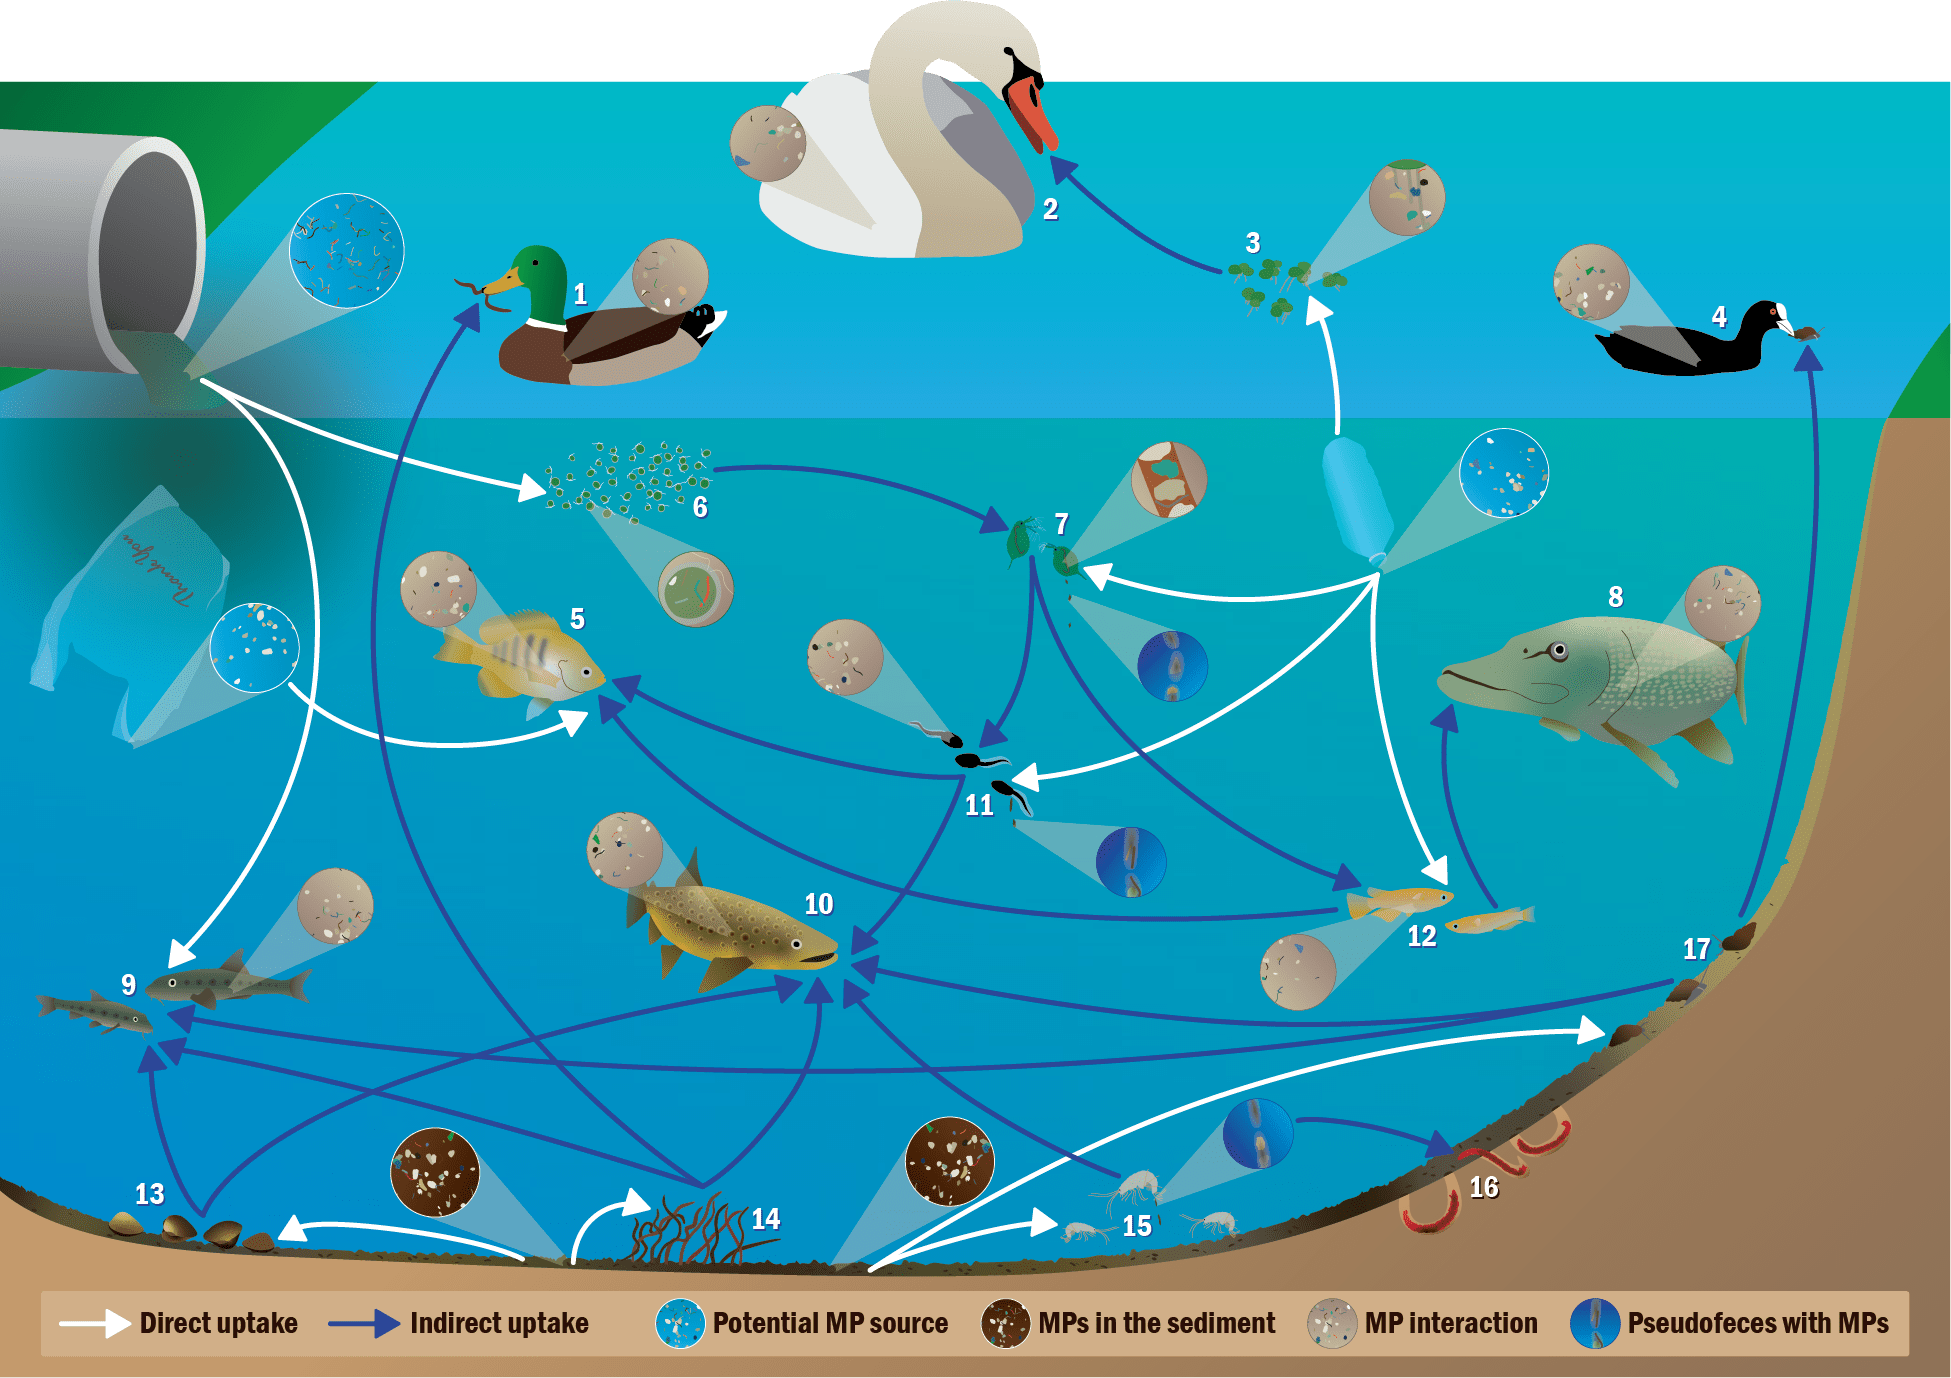
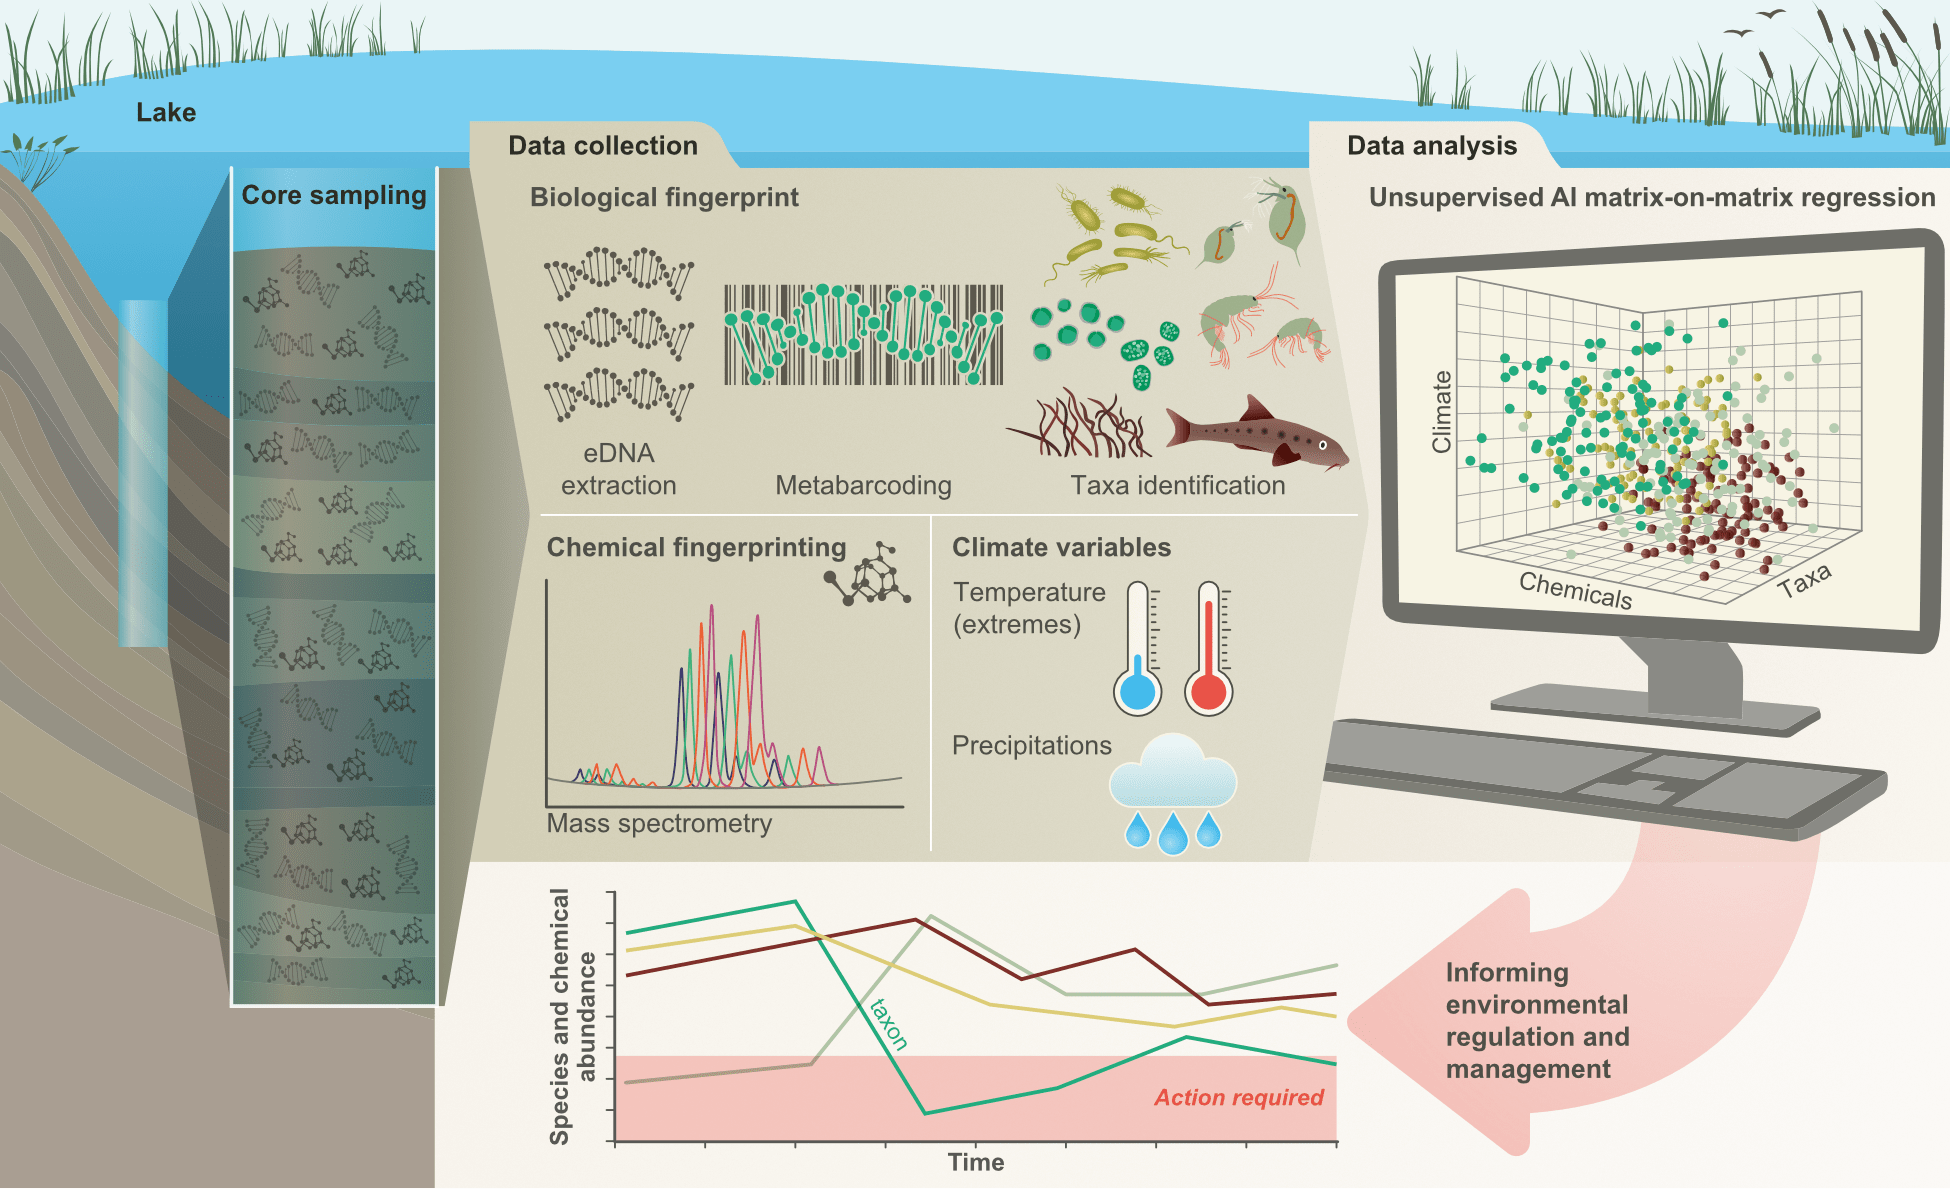
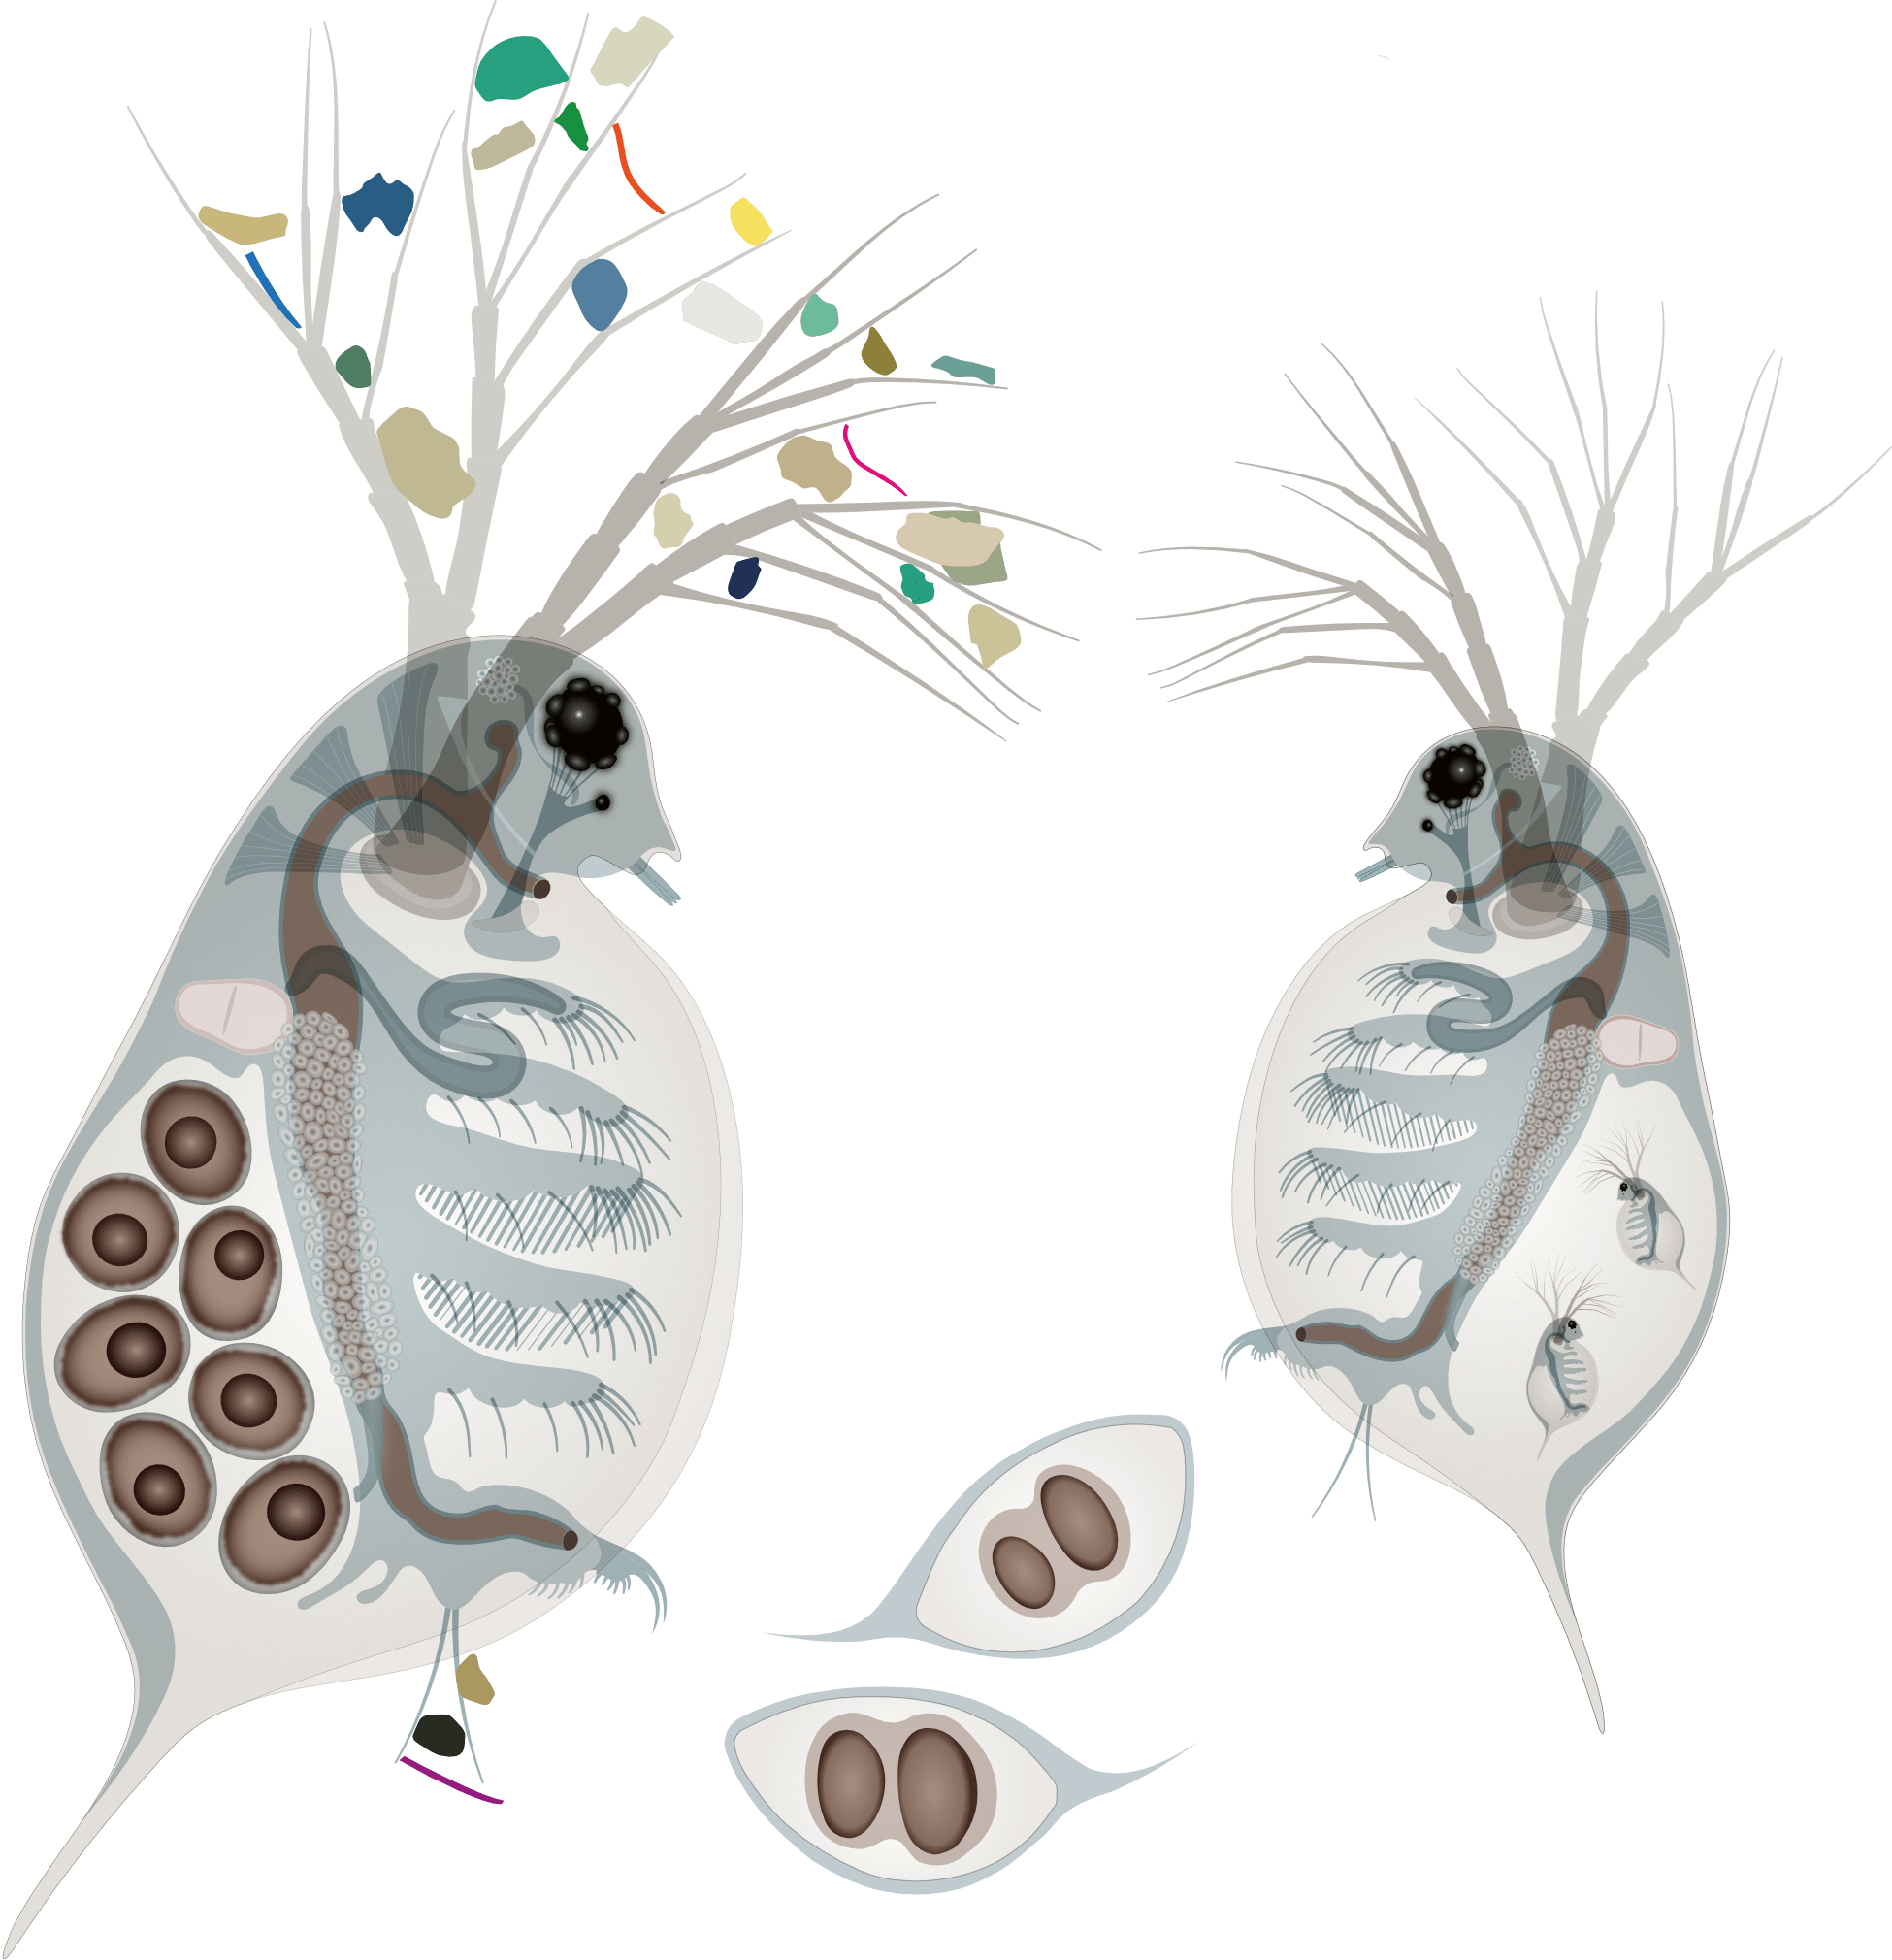
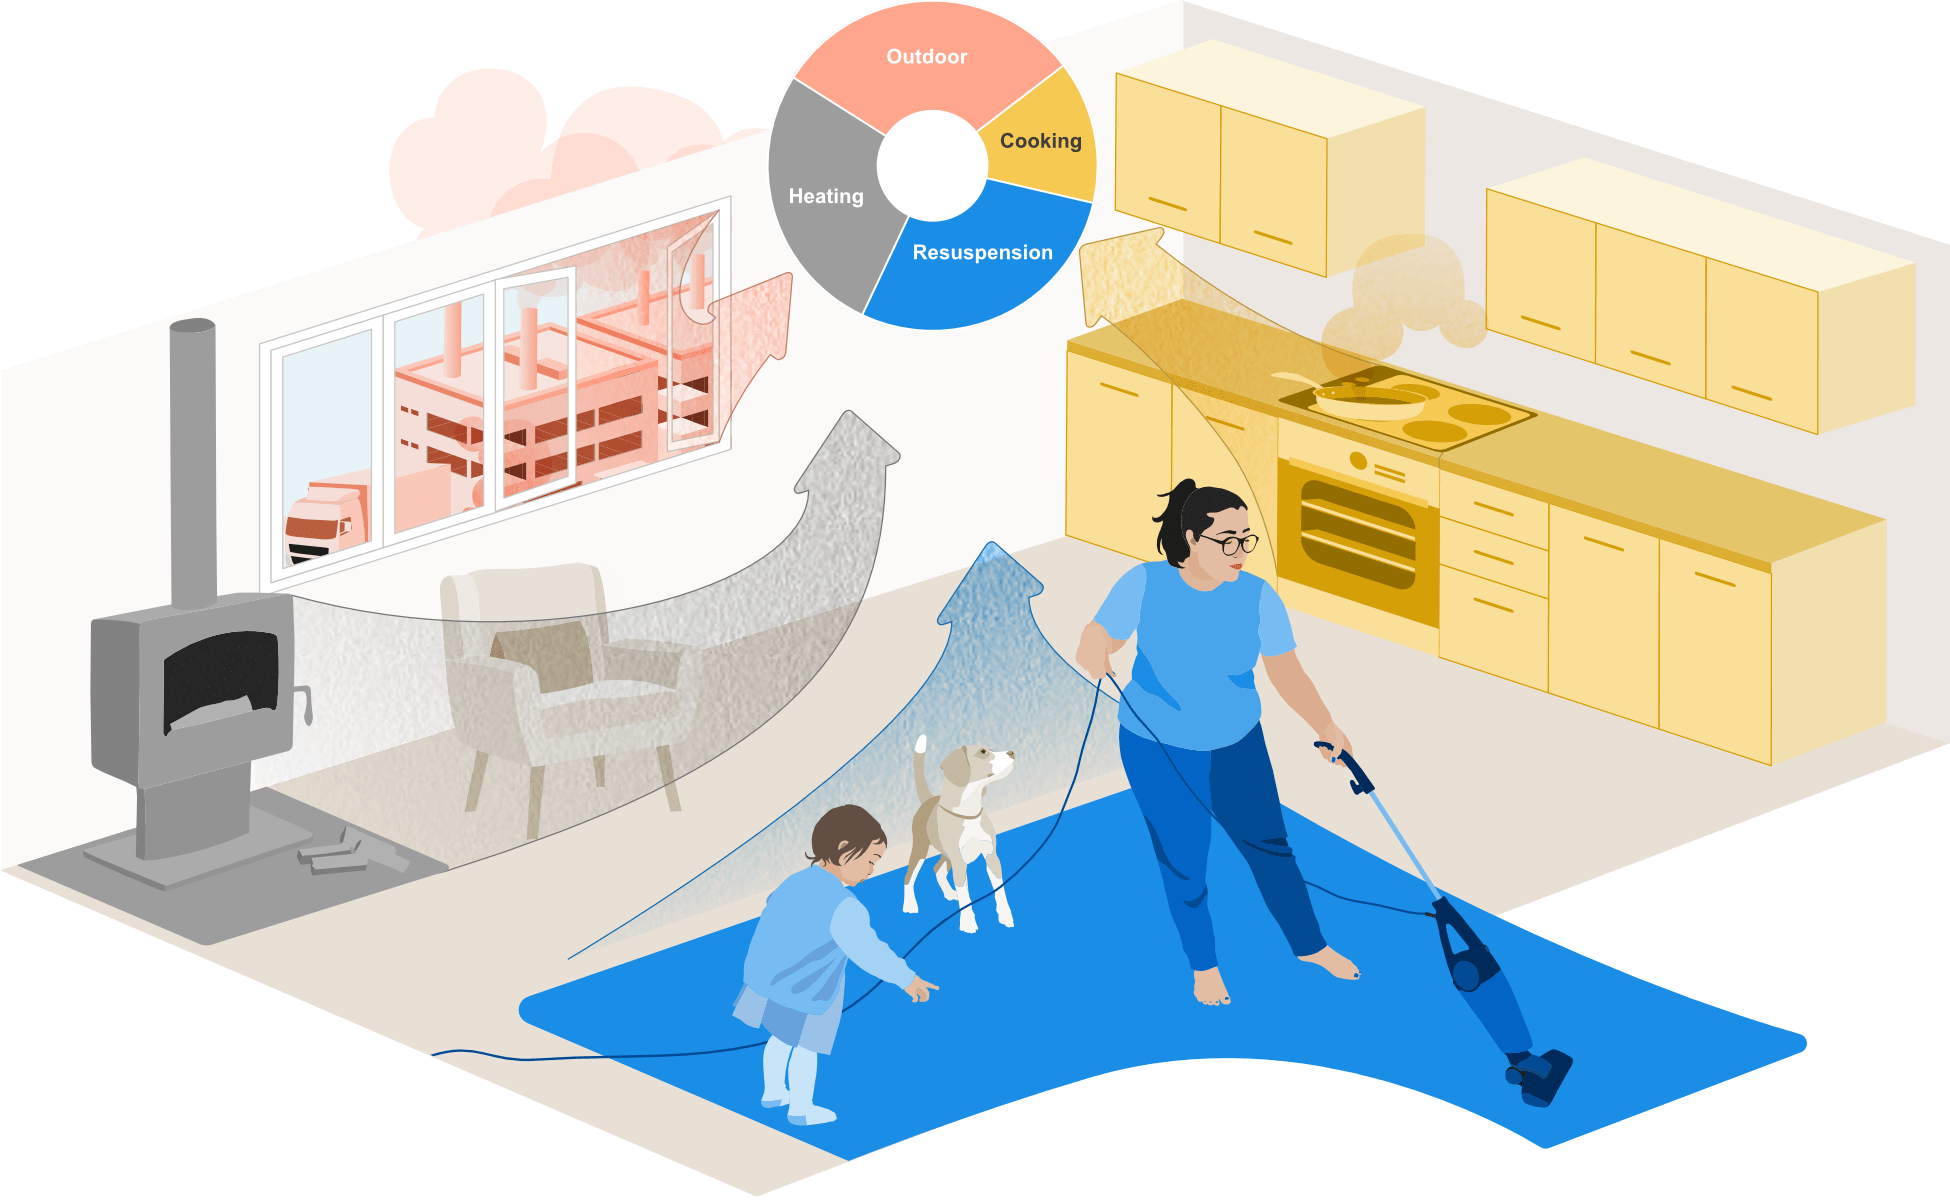
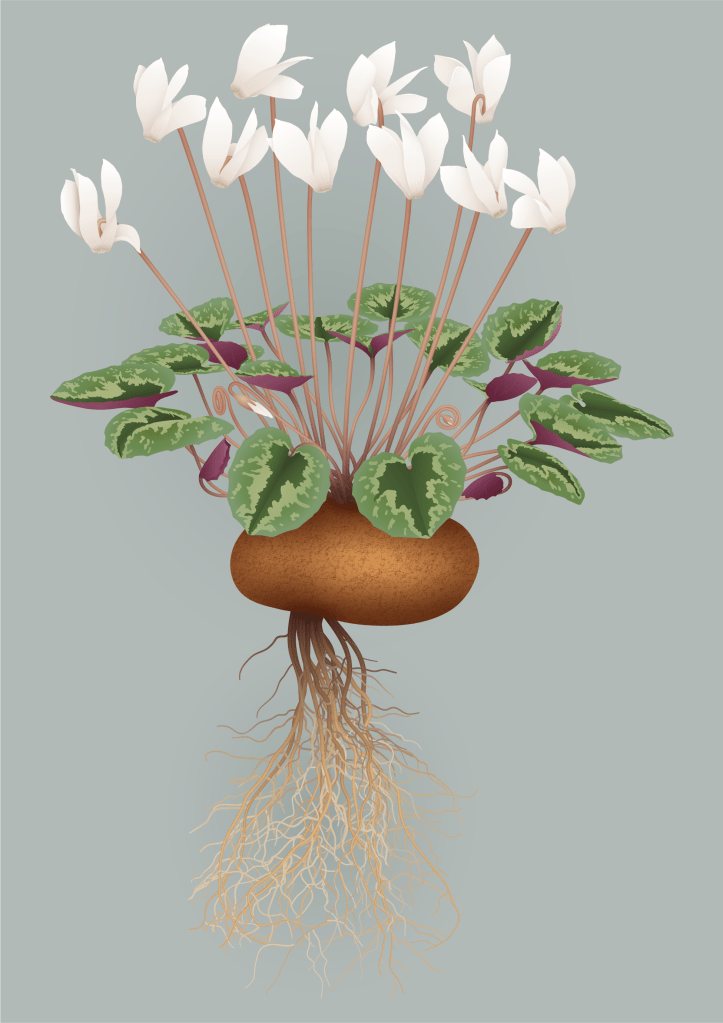
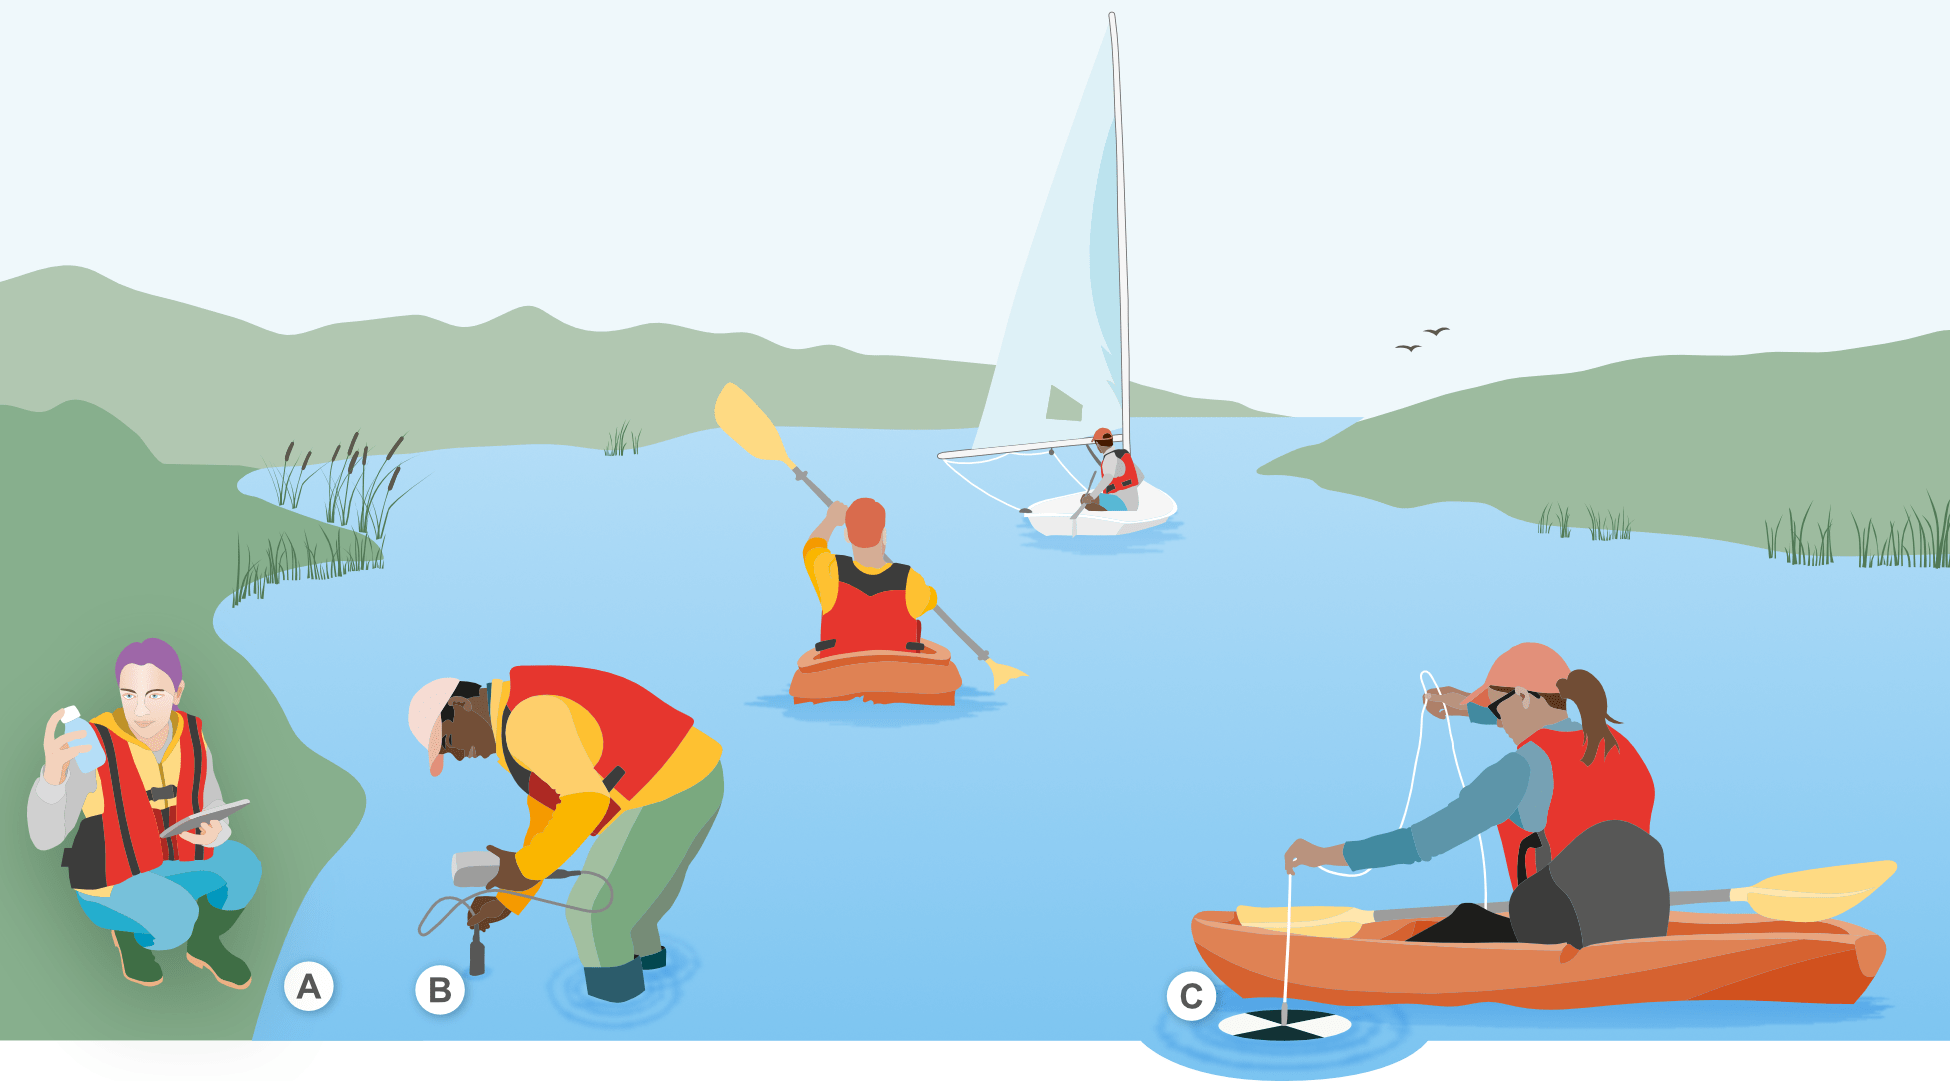
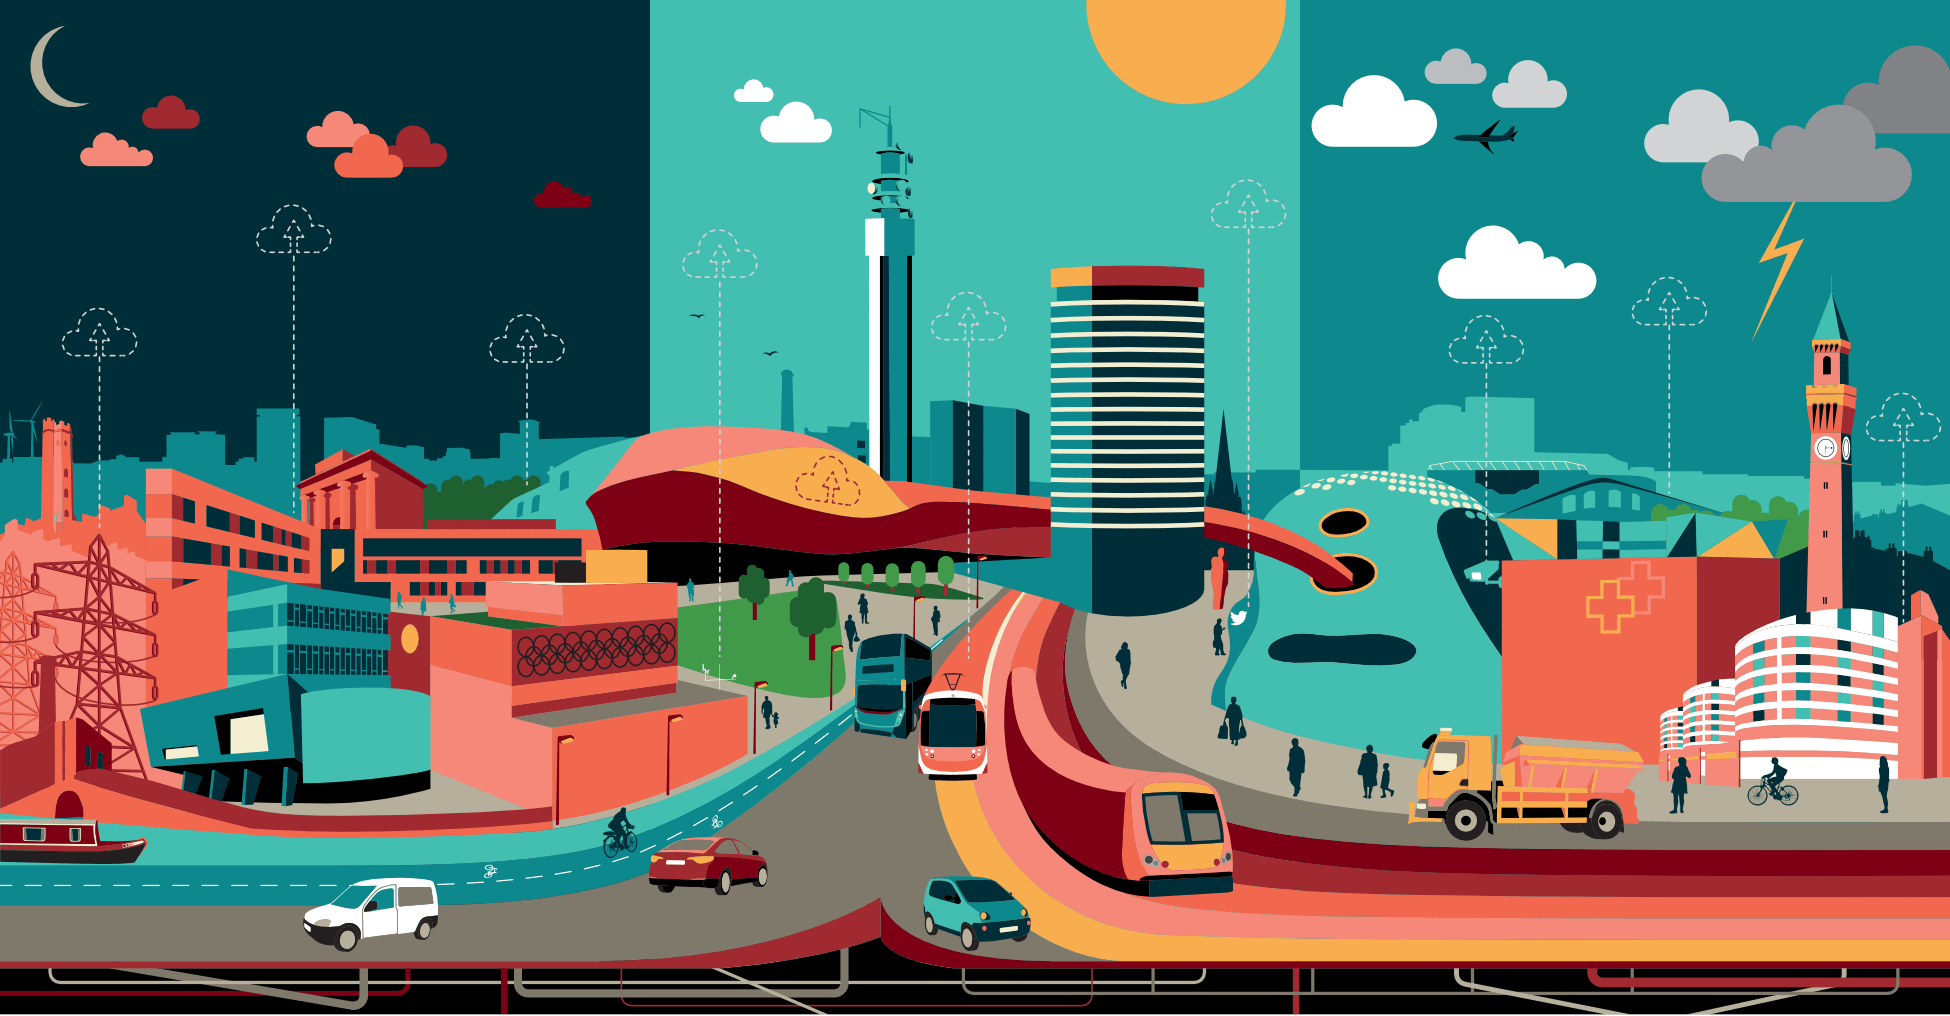
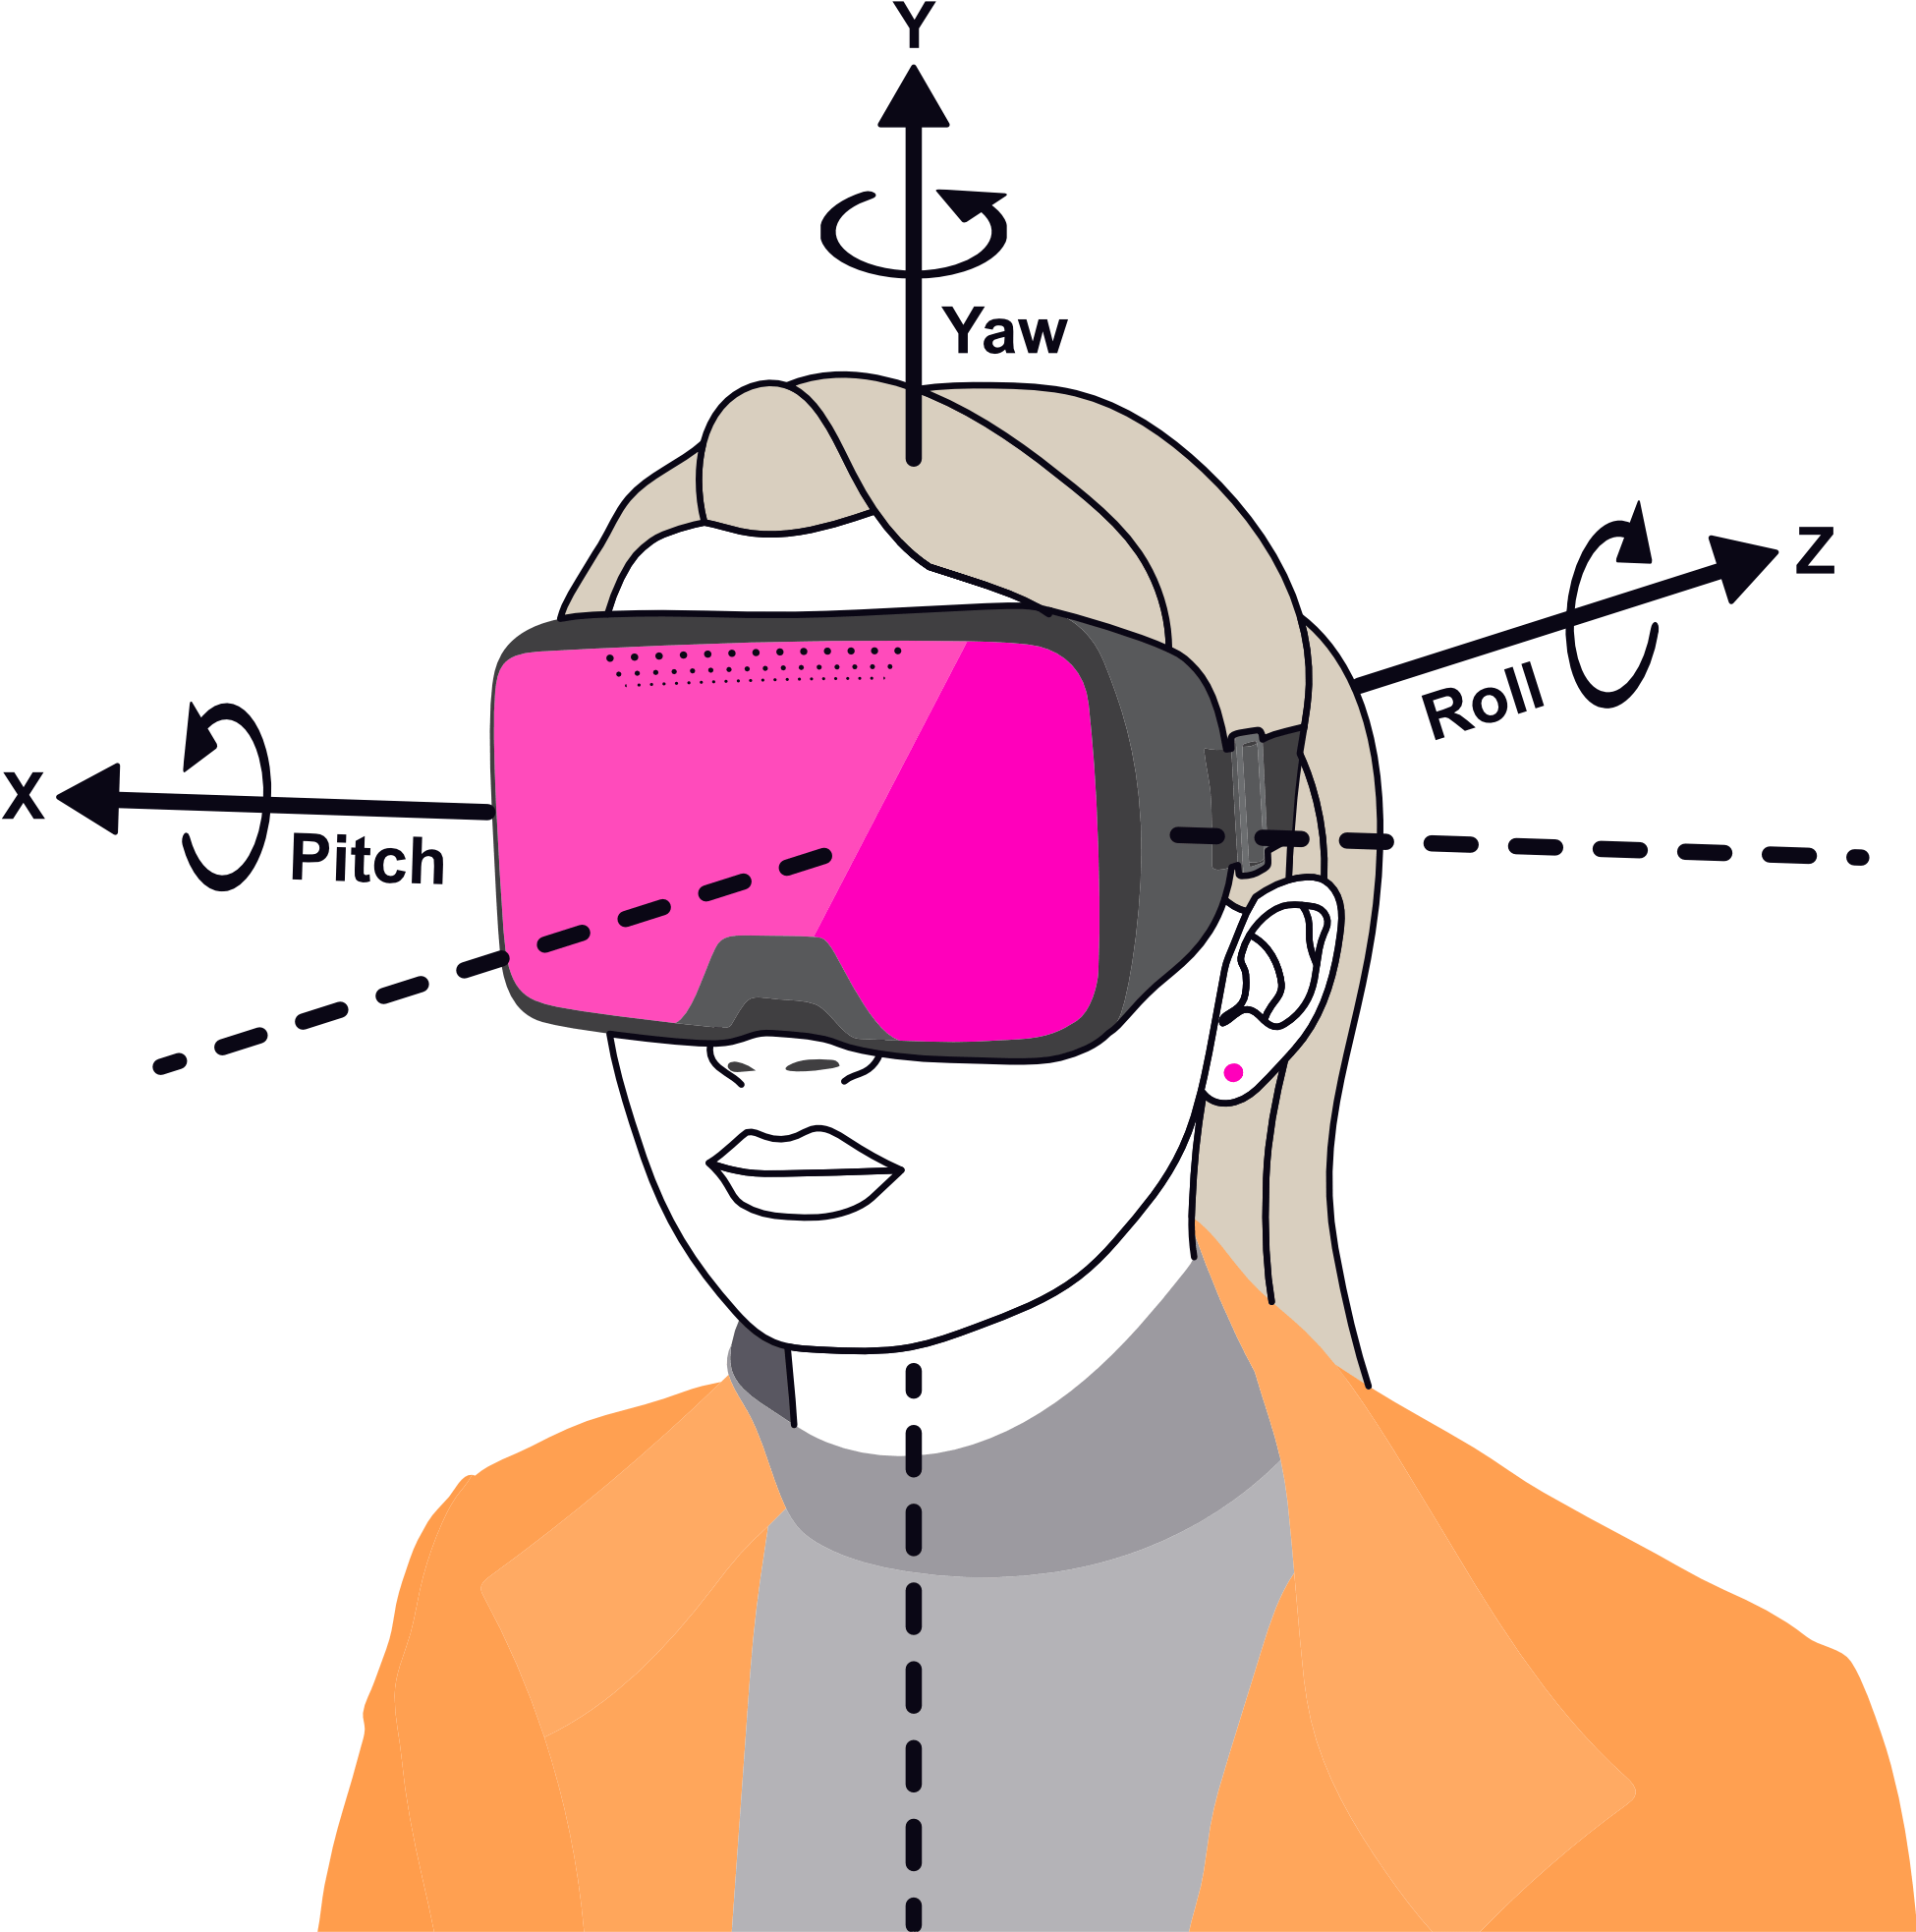
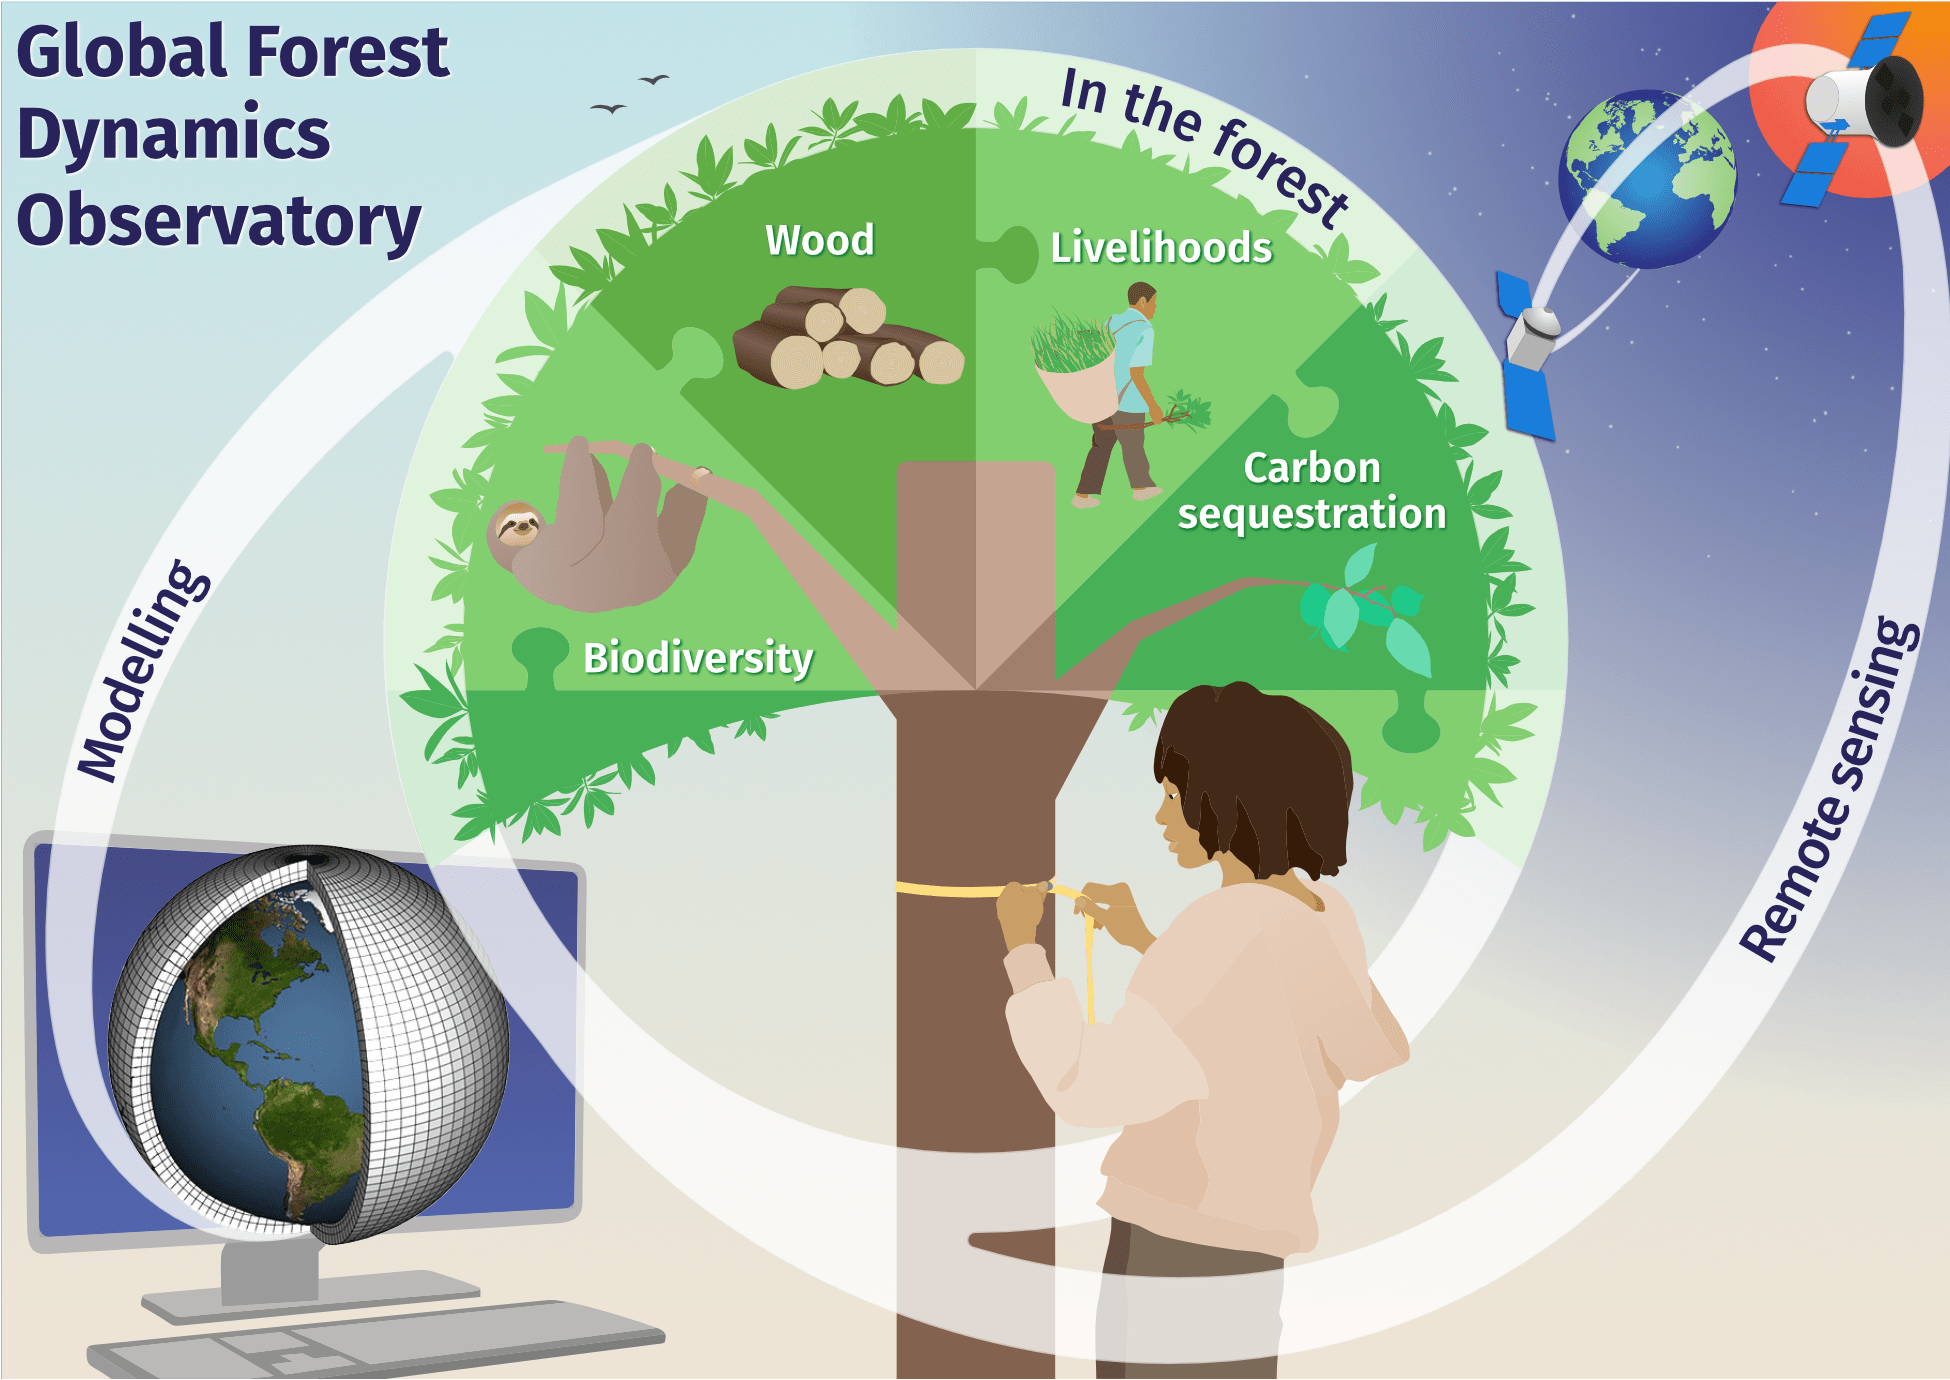
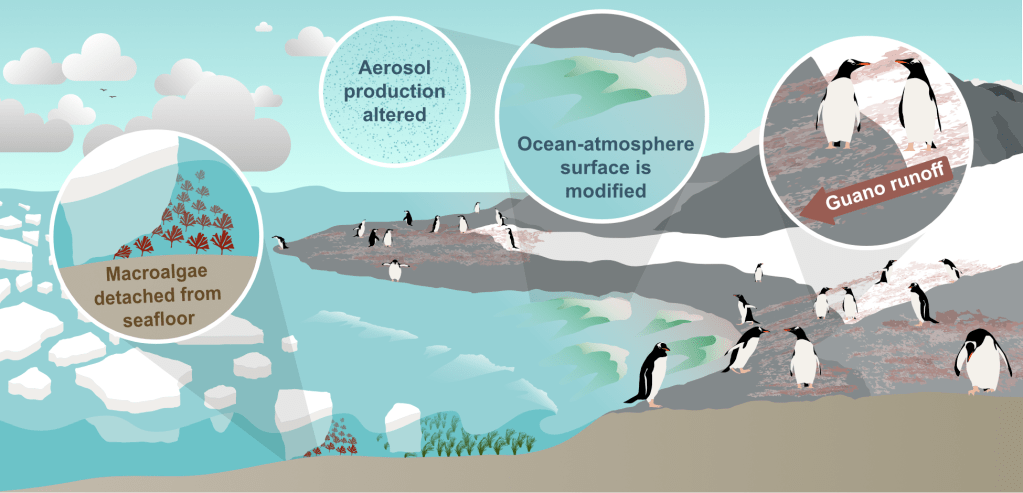
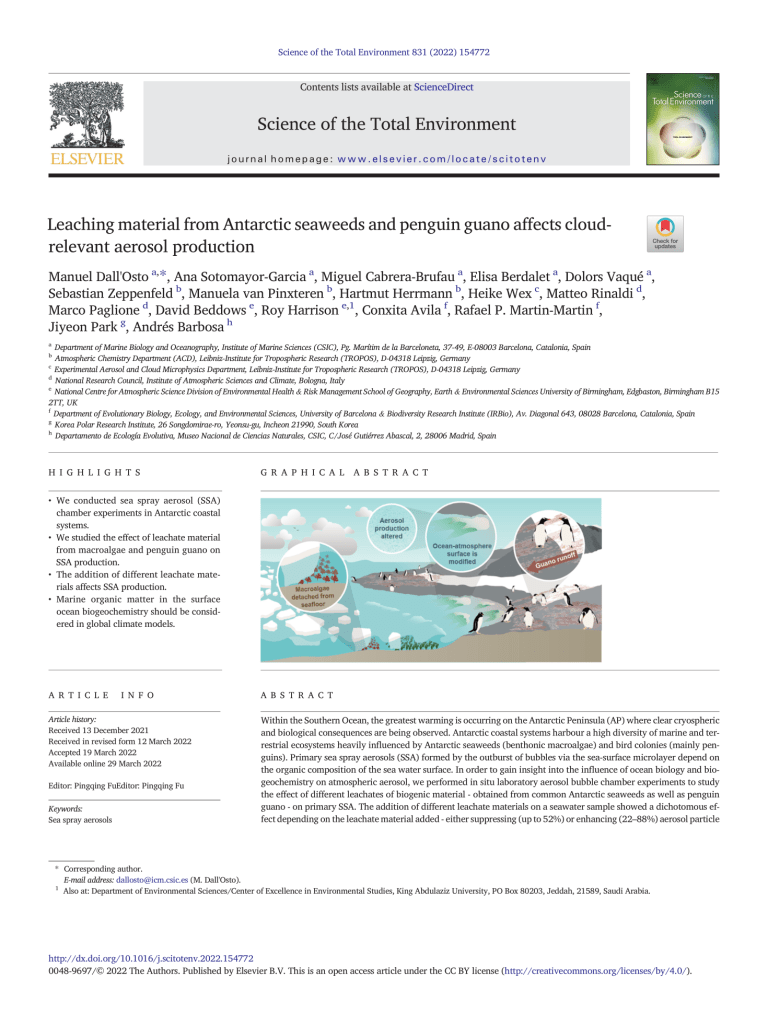
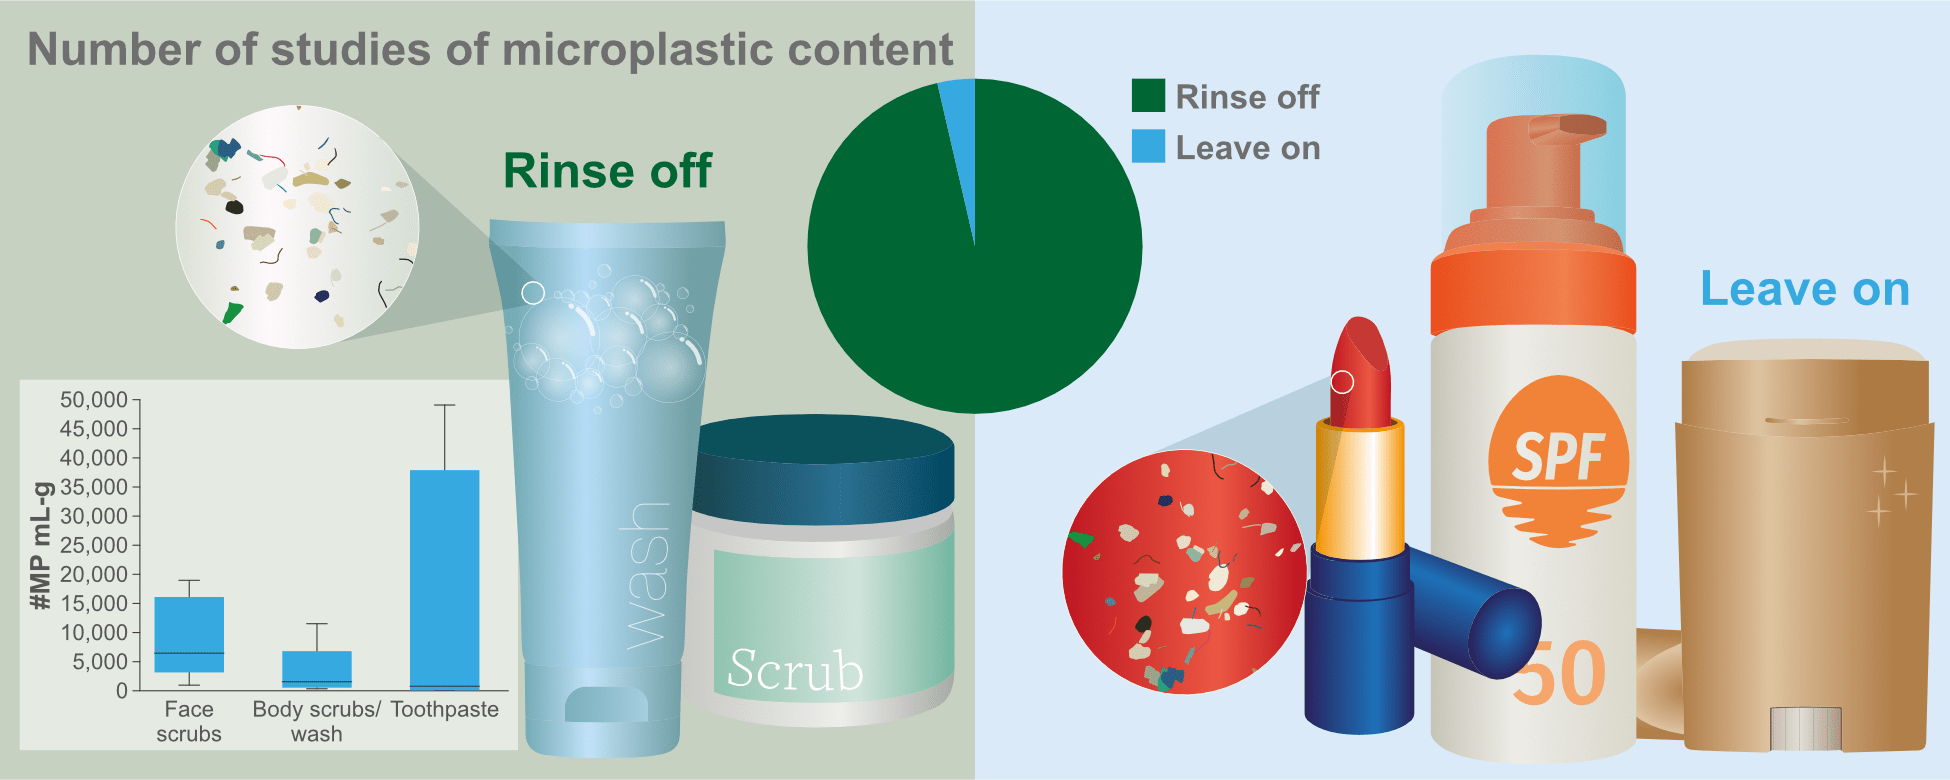
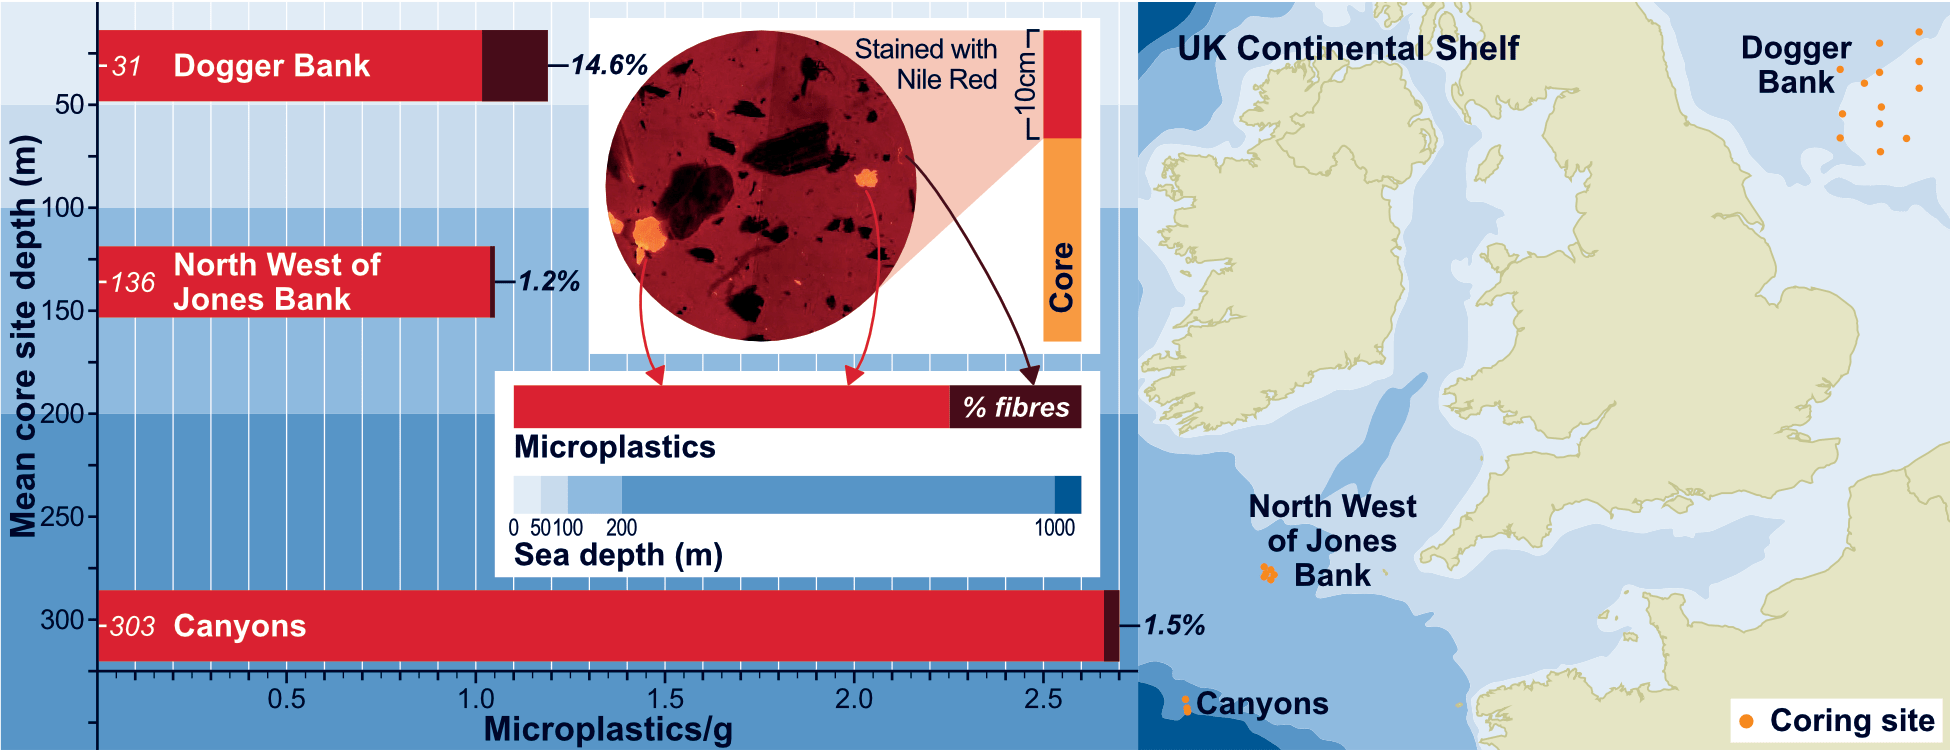
CuO Nanoparticles as Copper-Ion Reservoirs for Elesclomol-Mediated Intracellular Oxidative Stress. Along with the graphical abstract for the paper. Published in ACS Applied Nano Materials.Changes in the relative influence of dominant heat fluxes governing river water temperature (Tw) during routine low-flow conditions and different drought severities. Published in Hydrological Processes.Conceptual flow diagram of the water bioremediation process. Published in Science of the Total Environment.Conceptual model for MnP movements in the freshwater food web. Published in Environment International.100 years of anthropogenic impact causes changes in freshwater functional biodiversity – Conceptual framework. Published in eLife.Daphnia magna illustrations for use in figures for publications, presentations and public engagement.Sources of indoor air pollution. An illustration prepared for presentations and public engagement.Illustration of a Cyclamen cilicium f. album – personal workIllustration to showcase water quality testing techniques and highlight how water quality might affect those involved in watersports.Illustration of Brimingham for the Birmingham Urban Observatory project. @bhamurbanobsColour version of an illustration for Virtual Reality Methods – A Guide for Researchers in the Social Sciences and Humanities, by Phil Jones and Tess Osborne.Illustration of Lincoln Prison – used on a set of exhibition banners. Created for Professor of Carceral Geography, Dominique Moran.Illustration for the Global Forest Dynamics Observatory – used at forest and tree conferences.Leaching materials from Antarctic seaweeds and penguin guano affects cloud-relevant aerosol production – the graphical abstract. Published in Science of the Total Environment (and shown on the publication page as an example of how a graphical abstract might appear).Graphical abstract for Beyond microbeads: Examining the role of cosmetics in microplastic pollution and spotlighting unanswered questions. Published in Journal of Hazardous Materials.A large-scale study of microplastic abundance in sediment cores from the UK continental shelf and slope. The graphical abstract – published in Marine Pollution Bulletin.
Conference graphic for the BIFoR 2024 conference. Tap or rollover to start animation.